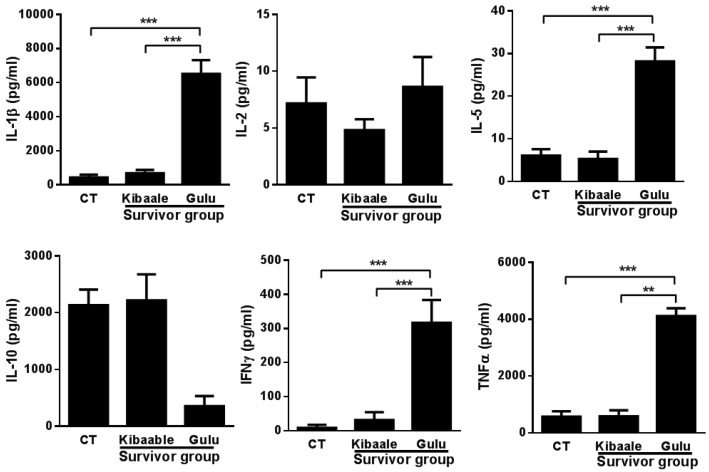
Figure 4.
Cytokine levels following EBOV GP1–649 stimulation of whole blood from Kibaale (1-year) and Gulu (12-year) ebolavirus survivors and non-infected controls (CT). Cytokine levels were measured in the plasma supernatants of samples following whole blood stimulation. Normalization of cytokine expression levels was performed by reducing the background (unstimulated value) of each individual stimulated (EBOV GP1–649) sample. Non-infected controls of Kibaale and Gulu are presented as average results since there were no significant changes between the two groups (Data not shown). Mean ± SEM, * p < 0.05.

