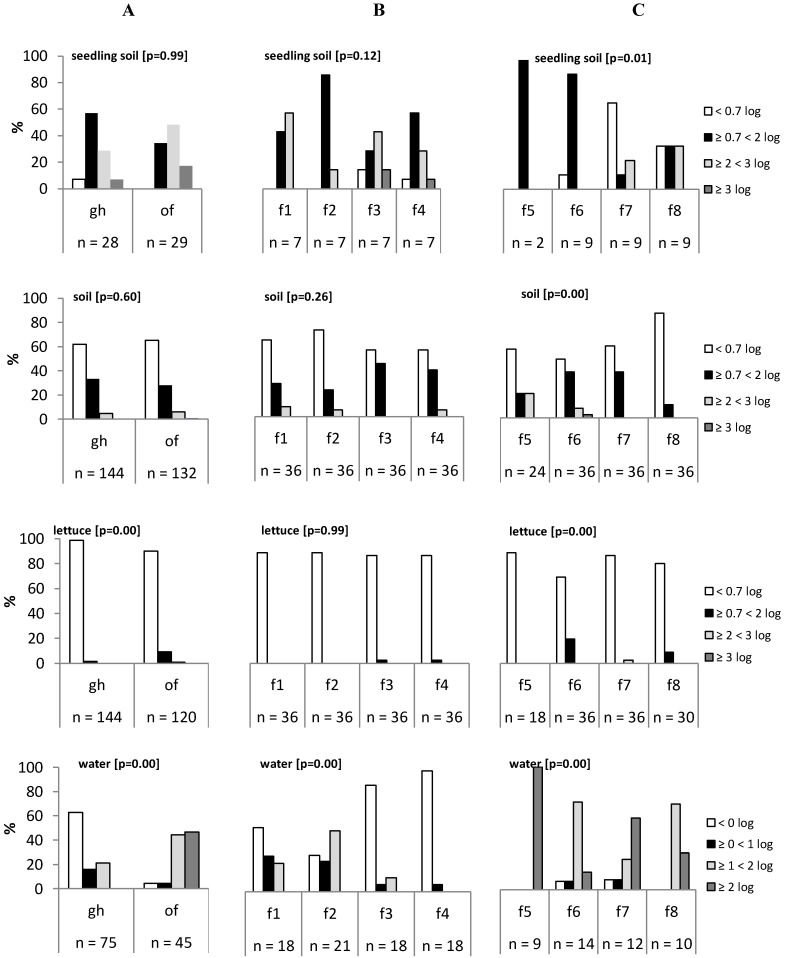
Figure 3.
(A) Comparison of E. coli distribution between greenhouse farms (gh) and open field farms (of) for seedling soil, mature plant soil, lettuce, and water. (B) Comparison of E. coli distribution between individual greenhouse farms (f1, f2, f3, f4). (C) Comparison of E. coli distribution between individual open field farms (f5, f6, f7, f8). The P-value is shown after the designation.

