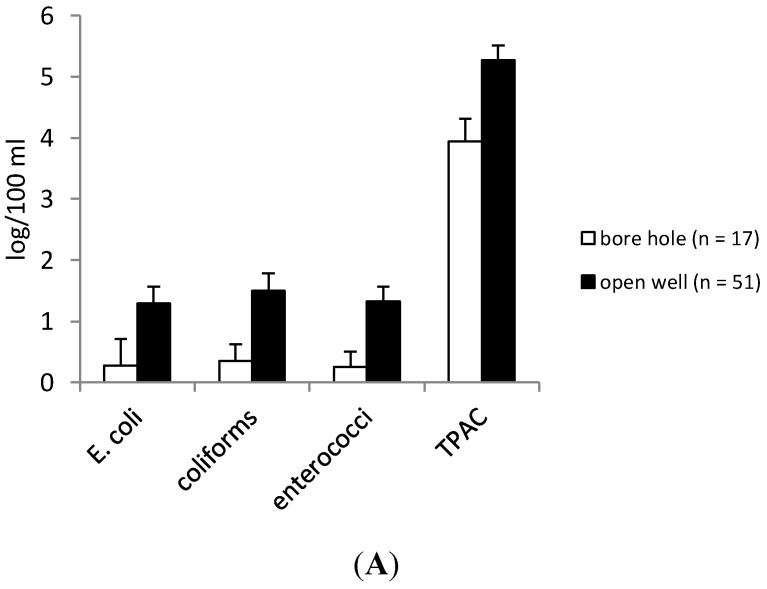
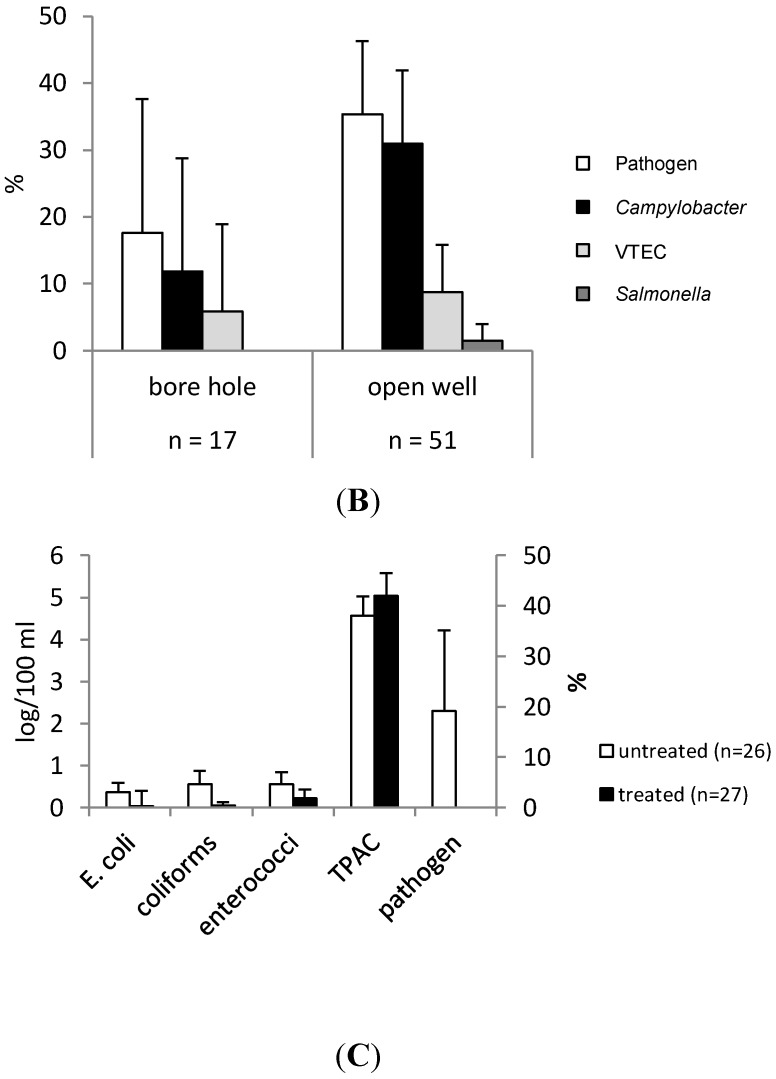
Figure 4.
Degree of contamination of the different indicator bacteria (log CFU/100 ml) (A) and pathogens (presence/absence in 1 l) (B) for borehole water (farms 3 and 4) and open well water (farms 1, 2, 5–8). (C) Impact of water treatment on the indicator bacteria and pathogens by comparing treated and untreated water for three farms applying water treatment (farms 1, 3 and 4). Bars show the 95% confident interval.


