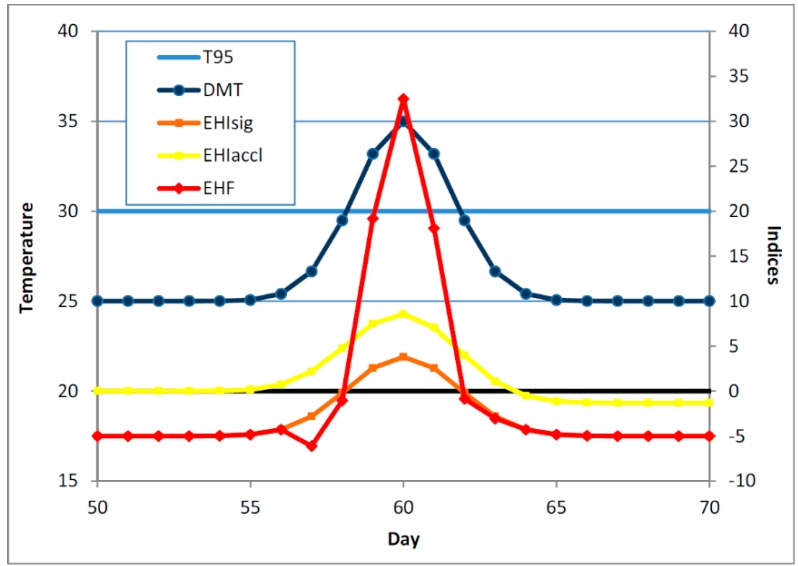
Figure 2.
Schematic representation of a short heatwave early in the summer season. The DMT and 95th percentile thereof (both in °C) are plotted against the left hand axis, while the three heatwave indices (in °C and K2) are plotted against the right hand axis. The heatwave indices are plotted against the middle day of the TDP, to facilitate comparisons with the DMT profile. The zero line for the indices is shown as a thick black line. Because of the shortness of the heatwave, the acclimatisation EHI is positive for rather longer than is the significance EHI. The notional T95 value in the schematic is 30 °C.

