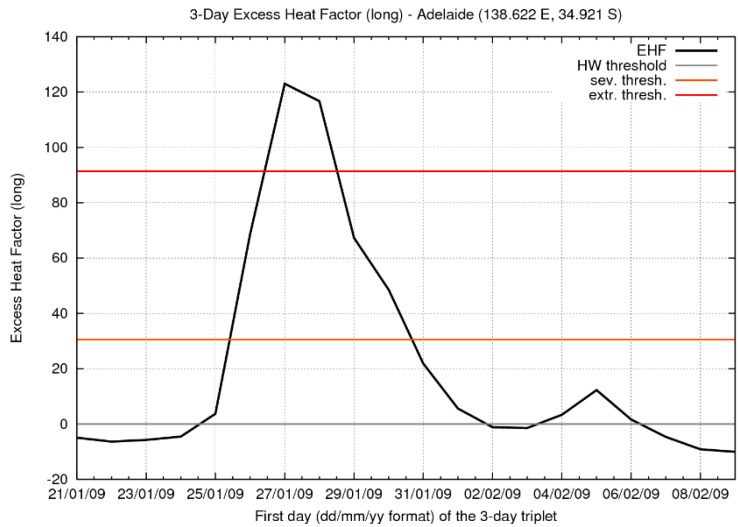
Figure 14.
EHF for Adelaide (South Australia) across the period 21–23 January to 9–11 February 2009 (black line). The horizontal axis indicates the first day of each TDP. The horizontal grey line marks the threshold for a low-intensity heatwave (i.e., zero EHF), while the orange and red horizontal lines mark the thresholds for severe and extreme heatwaves respectively. Data are derived from interpolating gridded analyses of EHF. T95 = 24.9 °C, with the severity threshold being 30.5 K2.

