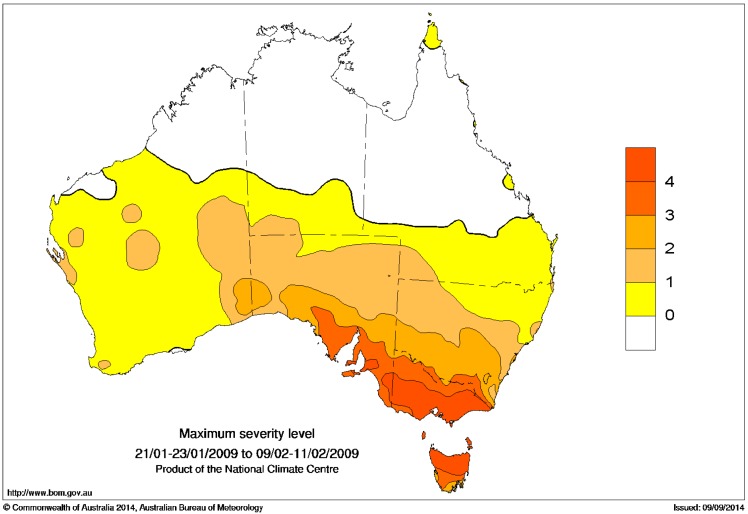
Figure 17.
As per Figure 16 but expressed in multiples of the severity threshold. Yellow denotes a low-intensity heatwave (ratios between 0 and 1). Dark orange colours denote an extreme heatwave (ratios of 3 and higher). Ratios between 1 and 3 denote a severe but not extreme heatwave.

