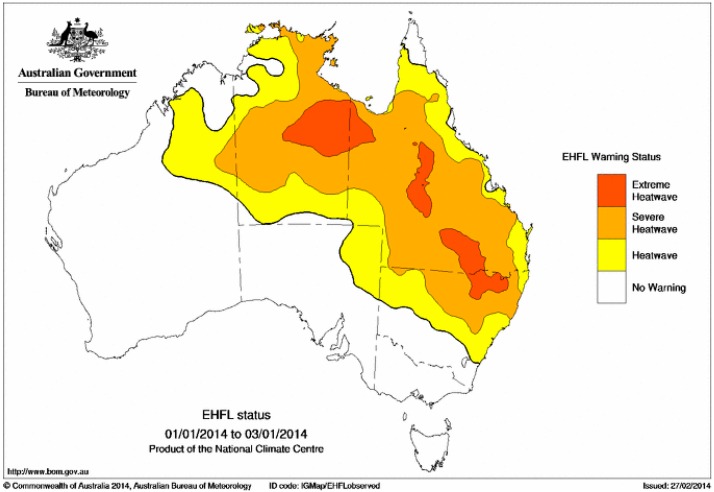
Figure A1.
Heatwave observational analysis for the TDP 1 to 3 January 2014. The map shows the EHF expressed as a multiple of the severity threshold EHF85, thereby indicating four categories; no heatwave (white), non-severe or low-intensity heatwave (yellow), severe but not extreme heatwave (orange), and extreme heatwave (red). The forecasts were issued in largely the same format.

