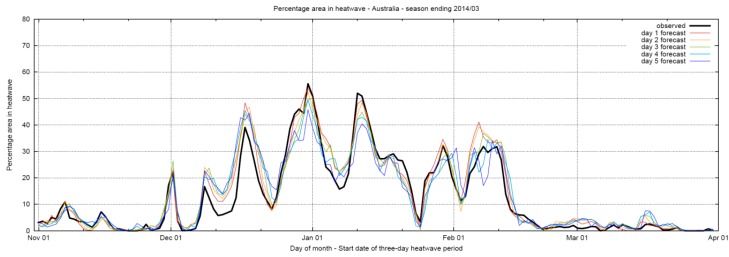
Figure A2.
Percentage area of Australia in heatwave, as observed and forecast, across the period November 2013 to March 2014. The calculation is performed across continental Australia and the main island of Tasmania. Meridional convergence is taken into account when calculating the percentage areas.

