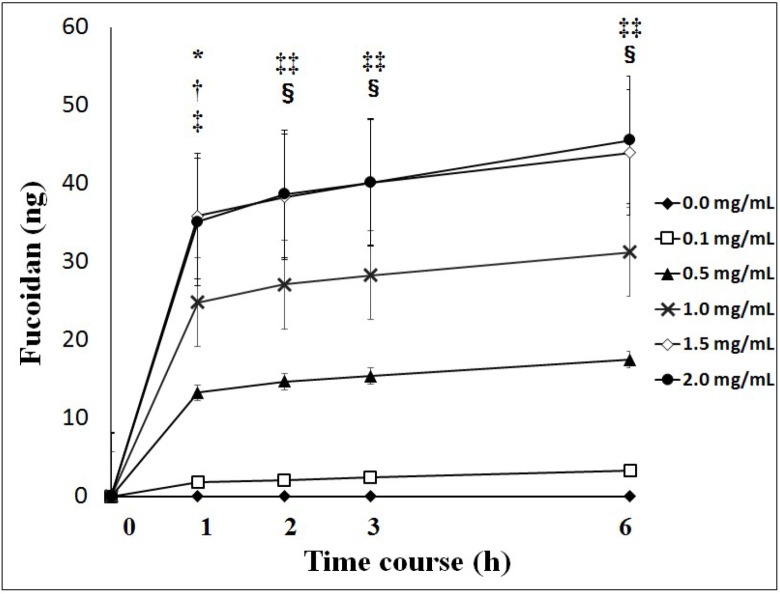
Figure 1.
Cumulative values of fucoidan across Caco-2 cells. Cumulative values of fucoidan were significantly higher with 1.0, 1.5 and 2.0 mg/mL of fucoidan than with 0.1 and 0.5 mg/mL of fucoidan. Results show the mean ± S.E of 5 experiments. * p < 0.05 0.1 mg/mL of fucoidan vs. 1.0 mg/mL of fucoidan; † p < 0.01 0.1 mg/mL of fucoidan vs. 1.5 and 2.0 mg/mL of fucoidan; ‡ p < 0.05 0.5 mg/mL of fucoidan vs. 1.5 and 2.0 mg/mL of fucoidan; ‡‡ p < 0.01 0.1 mg/mL of fucoidan vs. 1.0, 1.5 and 2.0 mg/mL of fucoidan. § p < 0.01 0.5 mg/mL of fucoidan vs. 1.5 and 2.0 mg/mL of fucoidan. Statistical analyses were performed using two-way ANOVA.

