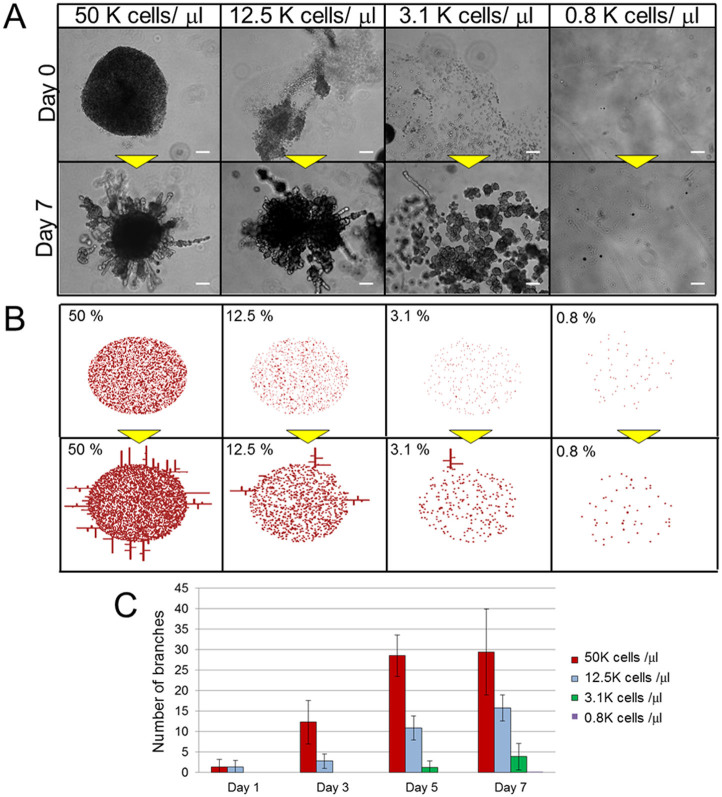
Figure 3. Comparison of lung airway morphogenesis at different cell concentrations.
(A) Phase contrast images of NHBE cells with 50 × 103 cells/μl, 12.5 × 10³ cells/μl, 3.1 × 10³ cells/μl, and 0.8 × 10³ cells/μl at day 1 and day 5. The injected cells formed aggregates, and branch formation was proportional to the initial number of cells injected. Scale bar: 200 μm. (B) The initial conditions and the results after 4000 calculation iterations of reaction-diffusion model in various cell concentrations in the center area. The branches were generated in the cases of higher concentration, and branches increased with increasing concentration. Parameters: c = 0.04 ± 5%, μ = 0.12, ν = 0.04, ρA = 0.014, ρH = 0.00014, c0 = 0.02, γ = 0.02, ε = 0.087, d = 0.0013, e = 0.1, f = 10, DA = 0.015, DH = 0.18, DS = 0.06 (C) Numbers of branches >100 μm in length. In cases of higher concentrations, the branches were generated from day 1, and the numbers of branches increased rapidly, while branching did not develop (or required more time to develop) at lower cell seeding densities. The number of branches were increased with increasing cell seeding densities in a certain area (R = 0.88, p = 0.0037). Error bars indicate standard deviation (n = 8).

