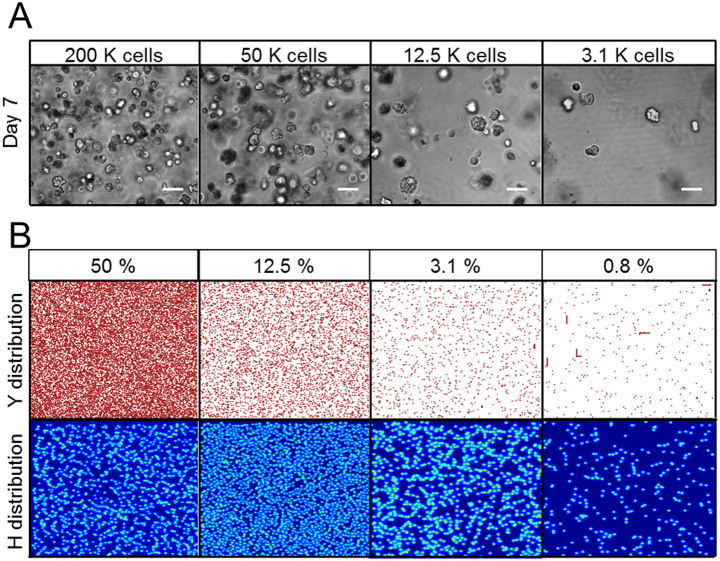
Figure 4. NHBE cell morphogenesis following homogeneous distribution of cells in Matrigels.
(A) Phase contrast images of homogeneously distributed NHBE cells cultured with various cell concentrations at day 7. Even when cells were seeded at high concentration, no branching was observed under homogeneous seeding conditions. Scale bar: 100 μm. (B) Result of reaction-diffusion model calculations with various cell concentrations. Cells were distributed homogeneously in a confined space. Y distribution indicates normalized cells positions and size. H distribution indicates normalized inhibitor concentration distributions produced by cells themselves. At higher cell concentrations, the inhibitor was occupied in a confined space and inhibited cell growth. Parameters: c = 0.04 ± 5%, μ = 0.12, ν = 0.04, ρA = 0.014, ρH = 0.00014, c0 = 0.02, γ = 0.02, ε = 0.087, d = 0.0013, e = 0.1, f = 10, DA = 0.015, DH = 0.18, DS = 0.06.

