

Abstract
Oscillatory interactions within functionally specialized but distributed brain regions are believed to be central to perceptual and cognitive functions. Here, using human scalp electroencephalography (EEG) recordings combined with source reconstruction techniques, we study how oscillatory activity functionally organizes different neocortical regions during a tactile discrimination task near the limit of spatial acuity. While undergoing EEG recordings, blindfolded participants felt a linear three-dot array presented electromechanically, under computer control, and reported whether the central dot was offset to the left or right. The average brain response differed significantly for trials with correct and incorrect perceptual responses in the timeframe between 140 and 175 ms. During trials with correct responses, source-level peak activity appeared in the left primary somatosensory cortex (SI) at around 45 ms, in the right lateral occipital complex (LOC) at 130 ms, in the right posterior intraparietal sulcus (pIPS) at 160 ms, and finally in the left dorsolateral prefrontal cortex (dlPFC) at 175 ms. Spectral interdependency analysis of activity in these nodes showed two distinct distributed networks, a dominantly feedforward network in the beta band (12-30 Hz) that included all four nodes and a recurrent network in the gamma band (30 -100 Hz) that linked SI, pIPS and dlPFC. Measures of network activity in both bands were correlated with the accuracy of task performance. These findings suggest that beta and gamma band oscillatory networks coordinate activity between neocortical regions mediating sensory and cognitive processing to arrive at tactile perceptual decisions.
Keywords: Oscillations, brain rhythms, EEG, ERP, somatosensory, touch, connectivity, Granger causality, perceptual decision-making
Introduction
Dynamic interactions between widely separated but functionally related brain regions are central for perception and cognition. Interactions among neural systems enable synchronization of neuronal oscillations and collective brain rhythms (Buzsaki and Draguhn, 2004). Oscillatory synchronization is a suggested mechanism underlying the perception of external stimuli (Engel et al., 2001; Singer, 1999; Varela et al., 2001). Sensory-guided, goal-directed behaviors such as planning appropriate motor responses to incoming stimuli, a process commonly known as perceptual decision-making (Gold and Shadlen, 2001, 2007; Heekeren et al., 2008; Usher and McClelland, 2001), involve multiple sub-processes such as encoding of sensory evidence, planning of actions and mapping of sensory information to action plans. Recent neuroimaging studies have begun to reveal large-scale oscillatory brain networks associated with perceptual decision-making processes in the visual domain (Siegel et al., 2011) and in the auditory-visual domains (Hipp et al., 2011). Yet little is known about the oscillatory brain networks underlying decision-making processes in the somatosensory domain.
Perceptual decision-making requires conscious stimulus perception and, in the somatosensory domain, is known to involve functional coordination between somatosensory regions and higher cognitive regions such as parietal and prefrontal cortices (Pleger and Villringer, 2013). Decision-making, as observed in monkeys performing vibrotactile discrimination tasks (Romo and de Lafuente, 2013), is a distributed function resulting from the joint activity of many higher-order cortical regions. How the decision-related brain activity emerges and binds parietal and prefrontal cortices is not completely understood. Previous functional magnetic resonance imaging (fMRI) studies (Sathian et al., 2013; Stilla et al., 2007; Stilla et al., 2008) have specified the brain regions associated with fine tactile spatial perception. These studies also examined directed interactions using blood oxygenation level-dependent (BOLD) data. However, brain networks that appear unified in fMRI studies because of slow BOLD hemodynamic responses may in fact include processes that occur on multiple time scales. Thus, how these interactions occur at the neural level on a millisecond time-scale, what frequencies of information flow bind these areas in a network, and the evolution of activity over time are largely unknown. Characterizing the temporal organization of neural responses is critical to a deeper understanding of the neural processes underlying tactile perception.
Past studies provide clues about the timing of somatosensory responses and the feedback of control (attention) signals. The primary somatosensory cortex (SI) responds to electrical stimulation of the finger within 20-60 ms (Allison et al., 1989; Mauguiere et al., 1997b), parietal cortex and frontal cortices respond within 70–110 ms (Forss et al., 1994; Forss et al., 1996; Mauguiere et al., 1997a) and the brain response at 140 ms is modulated by attention to somatosensory stimuli (Garcia-Larrea et al., 1995; Zopf et al., 2004). These findings are consistent with the idea that SI responds to feedforward input under the influence of top-down attentional signals, but where and how the relevant processes take place has not been resolved. Our hypothesis is that a tactile perceptual decision involves an oscillatory network linking somatosensory, parietal and prefrontal regions consistent with the flow of sensory and attention signals. Here, we designed an electroencephalography (EEG) study to test this hypothesis and provide insight into the neural basis of fine tactile spatial discrimination of the kind necessary for Braille reading, using a task near the limit of tactile spatial acuity.
Materials and Methods
Participants
Fifteen neurologically normal right-handed volunteers (12 male, 3 female) participated in this study after giving informed consent. Their ages ranged from 18 to 42 years (mean: 24.7 years, standard deviation: 5.7 years). Two participants were excluded from the final analysis because of poor behavioral performance and/or unmanageable artifacts and noise present in their EEG data. The Institutional Review Boards of Georgia State University and Emory University approved the experimental protocol.
Tactile stimulation
The experimental set-up was similar to that used in earlier fMRI studies (Stilla et al., 2007). A pneumatic stimulator was used to present tactile stimuli to the right index fingerpad. The tactile stimulus consisted of a three-dot array mounted on a square (20 mm × 20 mm) plate with the middle dot placed 1.94 mm to the left or right of the line joining the two outer dots spaced 4 mm apart, as shown in Figure 1 (A). Dot height was 0.64 mm above the plate surface. The right index finger was immobilized in the supine position (palmar side up) in a finger mold mounted on the base of the stimulator, using thick, double-sided adhesive tape that also served as padding for comfort. A disk atop the stimulator allowed 180° rotation of a stimulus to facilitate rapid switching between left and right offsets. Care was taken to ensure that the stimulus array was properly centered on the base plate so that this rotation would result in symmetric positioning of the two stimulus alternatives. The stimulus was applied for 1s. A computer program written in Presentation (Neurobehavioral Systems, Albany, CA) controlled stimulation sequences and provided records of stimulus timings for synchronization with EEG recordings. Participants were blindfolded during tactile stimulation, and did not see the stimuli during the study.
Figure 1. Experimental set-up and behavioral performance.

A. The middle dot of a raised 3-dot array was offset either to the right or left. A pneumatically driven stimulator presented stimuli to the right index fingerpad for 1s (on-interval) and participants responded within the next 2s (off-interval). B. Behavioral performance accuracy rates of better performers are displayed here. Better performers have at least 70 % correct responses in two runs.
Spatial Discrimination Task
Following the 1s stimulus, the participant responded within the next 2 s [Figure 1(A)]. Participants were asked to decide whether the central dot was offset to the left or right and to indicate their responses by right or left mouse-button clicks using the left hand. The offset used (1.94 mm) was near the spatial acuity limit under the conditions of stimulation.
Data acquisition and preprocessing
Prior to setting up for EEG acquisition, participants took part in a practice session to familiarize them with the task. Trials were presented in blocks of 20 with an equal probability of left and right offsets. Two such blocks comprised the practice session. Following EEG set-up, participants were briefed on the basic principles of EEG and how to minimize introducing contaminants into the ongoing EEG signals.
Continuous EEG was recorded using a Neuroscan system with a 68-channel electrode cap, AgCl sintered electrodes, and SynAmps2 amplifiers at a sampling rate of 1000 Hz/channel (Neuroscan Systems, Charlotte, NC, USA). Analog-to-digital conversion was performed at a resolution of 24 bits. The electrode cap was aligned to standard cranial fiducials and exploring electrodes were referenced against the right mastoid. Electrode impedances were kept below 10 kΩ. Recordings were done for 30 blocks in 7 participants, 20 blocks in 5 and 10 blocks in 3 participants. Behavioral performance was analyzed and participants were categorized as good performers if their accuracy was at least 70% correct. The number of blocks with correct responses was 18.0 ± 2.0 (mean ± standard error).
EEG data were band-pass filtered between 1-100 Hz and notch filtered to remove 60 Hz AC-line noise. Data from bad electrodes was discarded and replaced, when appropriate, by spatial interpolation of the recordings from the neighboring working electrodes.
Data analysis
The analysis of the preprocessed EEG included these main steps: (i) computation of ERPs, (ii) EEG-source reconstruction based on ERPs and distributed dipole modeling, (iii) reconstruction of single-trial source waveforms based on the identified sources and discrete dipole modeling, (iv) computation of power, coherence and Granger causality spectra based on single-trial waveforms and the parametric spectral approach (Dhamala et al., 2008a). The nonparametric wavelet-based spectral method (Dhamala et al., 2008a; Dhamala et al., 2008b) was used to examine the temporal variation of coherence. Details are provided below.
Event-related potentials (ERPs)
Using the stimulus onset times as reference, the data were segmented into trials of 700 ms duration (100 ms prestimulus and 600 ms poststimulus) and separated into correct and incorrect trials based on responses. For each trial, prestimulus data (100 ms prior to the stimulus) were used for baseline correction. Statistical procedures (Junghofer et al., 2000) were used in Matlab to identify outlier trials (3 standard deviations above or below the means) and discard them from the subsequent analysis. EEG trials associated with correct responses were collected from those task blocks that met the above-mentioned 70% correct performance threshold criterion for good performers. EEG trials for incorrect responses were also separated from all possible task blocks from all participants. Paired t-tests at α = 0.001 were performed at each time point to test for differences between trials with correct and incorrect responses. These tests were performed separately for each channel and each participant. We regarded the response as being significantly different for correct vs. incorrect responses if the t-tests were significant at least across 20 consecutive time points and 2 adjacent channels (cluster correction). The EEG data were averaged across participants to arrive at grand average ERPs for correct and incorrect responses separately.
EEG-source reconstruction
The grand average ERPs for correct responses were used in the Brain Electrical Source Analysis (BESA) Research software version 5.3.7 (www.besa.de) to reconstruct EEG sources on the cortical surface. We used the minimum-norm estimates (MNE) approach (Hamalainen and Ilmoniemi, 1994; Wang et al., 1992) to find the localized sources generating the scalp potentials. For distributed solutions, MNE uses l2 minimum-norm (Euclidean norm) estimates to constrain the source solution. The locations of the sources can be constrained to the cortical surface and their orientations constrained to be perpendicular to the local cortical surface (Dale and Sereno, 1993). Such constraints are based on the neurophysiological information that the sources of EEG signals are postsynaptic currents in cortical pyramidal cells, and that the direction of these currents is perpendicular to the cortical surface (Hamalainen et al., 1993). The peak activities of these sources were marked as network nodes for connectivity analysis. Using single-trial EEG data, we fitted dipoles at the peak activation locations of the localized sources with the dipole orientations given in Table S1. These dipole orientations were obtained from the MNE approach. We thus obtained single-trial source signal waveforms. The source signals were computed using a four-shell spherical head model and a regularization constant of 1% for the inverse operator. The source signals obtained from the single-trial EEG data were used in the connectivity analysis.
Power spectral analysis
In order to see how neuronal synchrony in specific brain areas varied for correctly perceived stimuli over time, we studied two epochs: an earlier (30-140 ms) and a later (140-210 ms) period. The ERP results showed that the somatosensory response peaked as early as ∼30 ms and differed for correct and incorrect responses starting at around 140 ms. For each epoch, we computed power spectra using the source waveforms from each network node. As the power density of EEG roughly follows power-law decay as frequency increases (Buzsaki and Draguhn, 2004; Freeman et al., 2000), modulations of spectral power are typically small in absolute magnitude at higher frequencies. Therefore, we computed the overall power spectrum and then separated the signal into two frequency ranges comprising the beta (12-30 Hz) and gamma (30-100 Hz) bands. This band-specific analysis allowed us to test whether beta and gamma band neuronal oscillations play independent roles in tactile perceptual decision-making as in the visual domain (Siegel et al., 2011). Band-specific, integrated power averages and the standard errors of the means were computed using data pooled across participants.
Coherence and Granger causality analysis
Spectral coherence between two oscillatory processes is a measure of statistical interdependence between them and is derived from the normalized cross-spectral density function. Coherence between neural processes reflects frequency-specific inter-areal synchrony between oscillatory neuronal processes. Spectral Granger causality measures the directional influence from one oscillatory process to another (Ding et al., 2006; Geweke, 1982). These measures can be computed both by parametric and nonparametric methods (Dhamala et al., 2008a; Dhamala et al., 2008b). Here, we applied the parametric method to single-trial EEG-source signals and computed network activity across the distributed neocortical regions found to be sources of the observed scalp-recorded activity. The difficulty of finding an optimal model order in the parametric approach (Dhamala et al., 2008a) was circumvented by comparing power spectra from the nonparametric and parametric approaches at different model orders and choosing the model order yielding the lowest power difference. We evaluated the patterns of causality spectra by using both bivariate and conditional Granger causality. Conditional Granger causality analysis (Dhamala, et al., 2008b) was performed to distinguish direct and mediated causal influences, and to retain only the direct ones in the Granger causality network. We used the parametric spectral methods for all of these calculations except that a wavelet transforms-based nonparametric approach (Dhamala et al., 2008a; Dhamala et al., 2008b) to determine the temporal changes of coherence that predicted the correct responses. The thresholds for statistical significance were computed from surrogate data by using permutation tests and a gamma-function fit (Blair and Karniski, 1993; Brovelli et al., 2004) under a null hypothesis of no interdependence at the significance level p < 10-6. We finally computed the net causal inflow by subtracting the Granger causality (obtained from the parametric method) out of the node from that into the node: , where N is the total number of nodes in a network and I the band-integrated Granger causality, with self-causality assumed to be zero. Here, a positive F represents the net incoming information flow towards the node (sink) and a negative F refers to the net outgoing flow away from the node (source). The coherence and Granger causality calculations were done on the ensemble-average removed source signals between the time intervals 30-210 ms after stimulus onset. To check whether these spectral measures, computed from single trial source waveforms after removing stimulus-triggered ensemble averages, are affected by trial-to-trial variability in latency and amplitude (Wang et al., 2008), we applied the analysis of single-trial ERP and ongoing activity (ASEO) algorithm (Xu et al., 2009) to remove ensemble averages from single-trial source waveforms from all the nodes. We then computed power, coherence and Granger causality again from these ASEO-method treated waveforms and compared these spectral quantities with those obtained from the single trials after removing stimulus-triggered averages as mentioned above.
Brain-behavior relation
We included all the behavioral and EEG data of all participants. For each participant, we computed behavioral accuracy defined as the ratio of the number of correct responses (trials) to the total number of responses (trials). The accuracy was then converted into z-scores by using the average accuracy and standard deviation of individual participant results. We computed coherence and Granger causality spectra from the source waveforms for all responses (both correct and incorrect) from all participants. We then extracted coherence and Granger causality peak values to correlate with accuracy. The relationship in the scatterplot was assessed by both Spearman's rank correlation and Pearson's correlation. A correlation was considered significant if p < 0.05 for both results. Results are reported in terms of Spearman's rank correlation. A positive correlation indicates that greater accuracy relates to higher network coherence or Granger causality.
Results
Behavioral results
The overall accuracy for the task among good performers (see Methods) was 88.2 ± 1.9% (mean ± standard error of the mean). Figure 1B shows the average accuracy for each good performer.
Electrophysiological results
Group-level average event-related potentials (ERPs)
As shown in Figure 2, the average ERPs differed significantly between correct (blue traces) and incorrect responses (green traces) at several scalp locations (shaded regions on the topographical map) during the timeframes indicated by the two vertical dashed lines in the ERP plots. These ERP differences between correct and incorrect responses survived paired t-tests at p < 0.001 and cluster-level thresholds (number of consecutive time points > 20 and number of adjacent channels > = 2) as described in the Materials and Methods section. Significant ERP differences in different blocks of channels were noted to begin around 140 ms.
Figure 2. Event-related potentials (ERPs).
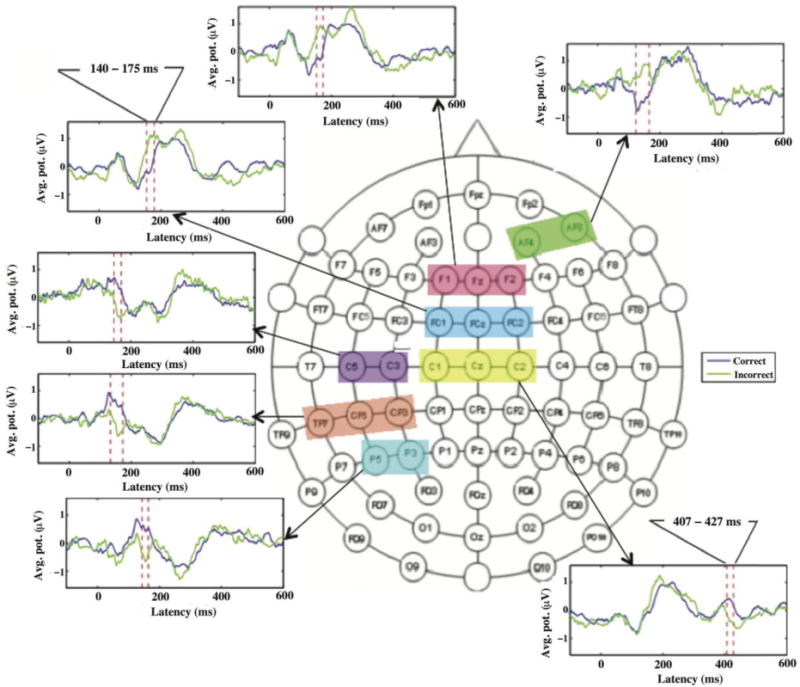
The shaded regions covering two or three labeled circles, in the 68-electrode EEG recording montage, show the locations in sensor space where ERPs differed significantly for trials with correct and incorrect responses in the timeframe 140 - 175 ms. The average waveforms, at representative sites from the shaded regions, are also shown for correct and incorrect responses.
Temporal evolution of cortically localized sources
The average ERPs for correct responses were used in the minimum-norm estimates (MNE) approach (Hamalainen and Ilmoniemi, 1994; Wang et al., 1992) to reconstruct the inverse EEG solutions. Figure 3 shows the locations of peak source activity (in dashed circles) as it traversed the cortical surface (first row), and the locations and orientations of the fitted dipoles used to obtain the single-trial source waveforms (second row). The earliest peak of cortical activity occurred in left SI at around 45 ms after stimulus onset, followed by activation in the right occipital region, in an area consistent with the location of the lateral occipital complex (LOC) at 130 ms, and then in the location of the right posterior intraparietal sulcus (pIPS) at 160 ms. Finally, at 175 ms, activation was seen in left dlPFC. Table S1 lists the ERP source locations, dipole orientations of the source model and activation time of cortical sources. The fitted dipoles at locations and orientations shown explained approximately 82% of the variance in the EEG signal for trials with correct responses.
Figure 3. Spatiotemporal profiles of peak source-level electrophysiological activity during trials with correct responses.

The top row represents minimum-norm estimate (MNE) sources with peak activity over L SI at 45 ms, R LOC at 130 ms, R pIPS at 160 ms and L dlPFC at 175 ms. The bottom row represents the corresponding fitted dipoles with their orientations. Abbreviations as in text.
Power spectra
Figure 4 (A-B) shows how source-level power in the beta- (12 - 30Hz) and gamma band- (30 - 100 Hz) frequency bands varied in the network nodes (SI, LOC, pIPS and dlPFC) during earlier (30 - 140 ms) and later (140 - 210 ms) periods of trials associated with correct responses. Significant power changes are detailed in Table S2. SI showed a significant decrease in power over time in both bands. In contrast, power in both pIPS and dlPFC increased in the gamma band but decreased in the beta band over time. LOC spectral power did not change significantly over time.
Figure 4. Spectral power and coherence.

Beta band (12- 30 Hz) (A), and gamma band (30-100 Hz) (B) spectral power during earlier (30-140 ms) and later (140 – 210 ms) periods. Power increases occurred only in the gamma band activity of pIPS and dlPFC. (C-D). For correct responses, pIPS-dlPFC coherence increased significantly in the later period.
Coherence spectra
Beta band coherence between the node-pairs SI-LOC, LOC-pIPS, SI-pIPS and pIPS- dlPFC was significantly higher for correct compared to incorrect responses (p<0.01) (not shown) and for the later period in comparison to the earlier period (p<0.05) [Figure 4(C)]. In contrast, beta band and gamma band coherences decreased over time for the SI-dlPFC node-pair (p<0.05). Gamma band coherence between pIPS and dlPFC was significantly higher for the later period in comparison to the earlier period (p<0.05) [Figure 4 (D)]. Gamma band coherence between pIPS and dlPFC during trials with correct responses was significantly higher than that in trials with incorrect responses, from as early as 117 ms and lasting until 158 ms (see supporting information and Figure S8 therein).
Beta band and gamma band Granger causality spectra
We computed Granger causality spectra to assess oscillatory network interactions among the four nodes of activity: SI, LOC, pIPS and dlPFC. Because of the frequency band-specific relevance of oscillations in perceptual decision-making (Siegel et al., 2011), we computed Granger causality spectra and separated the spectra into beta (12-30 Hz) and gamma (30-100 Hz) bands (Figure S1 in supporting information shows some of the results from a participant before separating frequency band-specific activities). To better assess the spectral specificity and temporal evolution of neuronal effects, we also performed time-frequency analyses separately for both beta and gamma band oscillations and examined the power spectra, coherence spectra and Granger causality spectra (see supporting information and Figures S6-S7 therein for details).
Figure 5(A-F) shows Granger causality spectra in the beta band and the net causal flow for the four-node network as a function of frequency within the beta band. In this band, there was bidirectional information flow between each of the three node-pairs involving SI, LOC and pIPS. Among these regions, the LOC received comparatively stronger influences from the pIPS and SI compared to outflow to these regions. The causal influence was unidirectional from the pIPS to dlPFC. The Granger causality spectral peaks occurred around 15 Hz. The dominant information flow here was, overall, consistent with the pattern of temporal evolution of the MNE source activation shown in Figure 3 (see supporting information and Figure S3 therein for further details of dominance in flow patterns). Figure S4 from the supplementary information shows the absence of organized feedforward or feedback network activity in the absence of task performance (prestimulus durations). We performed conditional Granger causality analysis to rule out mediated interactions between all possible node-pairs. The dashed lines in the Granger causality spectra in the left panel of Figure 5 (A-F) represent the significance threshold level. Figure 5 (G) shows the Granger causality network graph associated with correct responses. Figure 5 (H) shows the net beta band causal flow in the earlier and later epoch at each node. The pIPS functioned predominantly as a target in the earlier period with the LOC and dlPFC functioning mainly as sources; this pattern reversed in the later epoch. SI functioned as a source in both epochs, without a significant change in net causal flow over time.
Figure 5. Granger causality and net causal flow in the frequency range (0 – 30 Hz).

(A-F) Granger causality spectra when participants responded correctly; the peak causal influence is seen at roughly 13-16 Hz (low beta range). Significance thresholds (shown by dotted lines) as in text. (G) Schematic representation of the beta band Granger causality network graph associated with correct responses, based on the bivariate (pairwise) and trivariate (conditional) Granger causality results. (H) Significant changes in net causal inflow between earlier and later durations.
Similarly, we also evaluated the patterns of pairwise and conditional Granger causality and net causal inflow in the gamma band (Figure 6). Gamma band frequency oscillations around 80 Hz held SI, pIPS and dlPFC in the network while the LOC was excluded. Causal influence was directed from SI to dlPFC to pIPS and back to SI as a closed loop during correct responses [Figure 6 (H)]. The interaction from SI to pIPS was found to be mediated through dlPFC, since the causality from SI to pIPS after factoring out mediation through dlPFC (SI→ pIPS|dlPFC) [Figure 6 (G)] was not significant. As shown in Figure 6 (I), there were significant causal inflow differences between the earlier (30-140 ms) and later (140-210 ms) epochs in the pIPS and dlPFC (Table S3). The pIPS functioned mostly as a source of information flow in the earlier timeframe but as a target in the later timeframe, whereas the dlPFC became a more dominant source over time. SI and LOC showed no significant changes over time. The spectral peaks obtained after removing ensemble averages showed excellent agreement with the spectral quantities computed from the single trials after removing ensemble averages using the ASEO-method (Xu et al., 2009). [(see Figure S2 in the supplementary information for the spectral power and causality computed from the ASEO-method treated trials]. Note that stimulus-triggered activity was removed in both approaches. Following the method of time-shifted surrogates used in previous studies (Faes et al., 2013; Lindner et al., 2011), we verified that these networks were not affected by any residual volume conduction in reconstructed source signals (see supplementary information and Figure S5 therein for details).
Figure 6. Granger causality and net causal flow in the gamma band (30 – 100 Hz).

(A-F). Granger causality spectra when participants responded correctly. Significance thresholds (shown by dotted lines) as in text. (G) The conditional Granger causality spectra SI→ pIPS| dlPFC (green line). (H) Schematic representation of the gamma band network activity associated with correct responses, based on the bivariate and trivariate (conditional) Granger causality results. (I) Changes in net causal inflow (total incoming causal flow minus total outgoing flow for a node) between earlier and later durations.
Brain-behavior relation
Behavioral accuracy (expressed as z-scores) was found to be significantly positively correlated with measures of network activity in both beta and gamma bands. Accuracy was correlated with beta band coherence for SI-LOC, and pIPS- dlPFC [as shown in Figure 7 (A-B)] and with gamma band coherence for pIPS-dlPFC and SI-dlPFC [Figure 7 (C-D)]. Similarly, behavioral accuracy was also correlated with beta band Granger causality from pIPS to dlPFC [Figure 8 (A)] and with gamma band Granger causality from dlPFC to pIPS, and SI to dlPFC [Figure 8 (B-C)]. All these relationships between behavioral and neural measures are shown in Figures S9-S12.
Figure 7. Relation between coherence and behavioral performance.

Pairs of nodes showing positive correlations of beta band (A-B) and gamma band (C-D) coherence with behavioral performance (p < 0.05).
Figure 8. Relation between Granger causality and behavioral performance.

Beta band (A) and gamma band (C-D) Granger causality relationships among node pairs (p < 0.05).
Discussion
Fine tactile discrimination involves somatosensory processing, focusing attention on stimulus features, encoding the acquired sensory information, visualizing the stimulus features, and eventually forming decisions expressed in motor responses, as elaborated in previous studies (Pleger and Villringer, 2013; Romo and de Lafuente, 2013). Here, we obtained two important results that point towards unifying principles consistent with the sequence of these processes. First, ∼15 Hz beta network oscillatory activity was dominantly feedforward from somatosensory to parietal to prefrontal regions, similar to the propagation of average cortical activity, probably reflecting accumulation and maintenance of sensory information. Second, ∼80 Hz gamma network oscillations occurred in a recurrent closed loop from prefrontal to posterior parietal to somatosensory and back to prefrontal regions, implying involvement of this loop in attentional selection of task-relevant sensory evidence. Accuracy of tactile discrimination was significantly correlated with measures of network activity in both bands. These results provide direct evidence of recurrent information processing of sensory and attentional signals as in somatosensory awareness (Auksztulewicz et al., 2012) and in other forms of decision-making (Klein-Flugge and Bestmann, 2012; Selen et al., 2012). These findings, together with previous studies in the visual (Siegel et al., 2011) and auditory-visual domains (Hipp et al., 2011) suggest common oscillatory network mechanisms for perceptual decision-making across various sensory modalities. Further, these results are consistent with earlier fMRI studies of somatosensory perception: An fMRI study (Stilla et al., 2007) with a similar stimulation protocol to this study found that the paths predicting acuity converged from the left postcentral sulcus (PCS) and right frontal eye field (FEF) onto the right pIPS, consistent with interaction between feedforward somatosensory signals and feedback control signals. Similarly, other fMRI studies on haptic perception revealed evidence for both bottom-up projections from somatosensory cortex and top-down paths from prefrontal and parietal cortex to the LOC (Deshpande et al., 2010; Deshpande et al., 2008; Peltier et al., 2007). Our results provide a new understanding of the role of oscillatory interactions within these somatosensory and frontoparietal networks during tactile perceptual decision-making. Neuronal responses within these neural networks are subject to modulation by the level of prestimulus activity, as shown previously (Haider and McCormick, 2009; Sadaghiani et al., 2010); however, the impact of variability of prestimulus activity on evoked neural responses is beyond the scope of the present study.
Cortical Sources of Neural Activity
Sensor-level brain responses associated with correct and incorrect perception differed around 140-175 ms after stimulus onset. MNE-localized cortical sources from these responses propagated from left SI at around 45 ms to the right LOC at 130 ms, to the right pIPS at 160 ms and finally to left dlPFC at 175 ms, outlining a feedforward sweep. Contralateral SI activation within the 30-50 ms timeframe is consistent with a previous ERP study (Lucan et al., 2010) for tactile stimuli varying in shape. The LOC is known for visuotactile convergence of information relating to object shape (Amedi et al., 2002; Amedi et al., 2001; Stilla and Sathian, 2008; Zhang et al., 2004). The right LOC activation found here at around 130 ms could be associated with visualizing tactile stimulus features (Lucan et al., 2010). Previous studies have found LOC activation more consistently in the right hemisphere (Coghill et al., 2001; Stilla et al., 2007; Stilla and Sathian, 2008; Tomlinson et al., 2011; Zhang et al., 2004). As for SI, the right pIPS and left dlPFC activations were somewhat delayed relative to those observed with electrical stimulation of the median nerve (Allison et al., 1989; Forss et al., 1994; Forss et al., 1996; Mauguiere et al., 1997a, b), which excites peripheral afferents synchronously at a more proximal location. The pIPS activation may reflect the role of posterior parietal cortex in tactile perception (Peltier et al., 2007; Stilla et al., 2007; Stilla and Sathian, 2008) and spatial attention (Corbetta and Shulman, 2002; Siegel et al., 2008). Activation seen in left dlPFC at around 175 ms may indicate a role for this region in working memory (WM), or in encoding and maintaining decisions (Opitz et al., 2000; Roux et al., 2012) until a motor response is generated.
Processing of either consciously perceived stimuli (Feinstein et al., 2004; Marois et al., 2004; Sahraie et al., 1997) or imperceptible sensory stimuli (Blankenburg et al., 2003; Colder and Tanenbaum, 1999; Meador et al., 2002; Sahraie et al., 1997) involves a widespread network, including SI (Blankenburg et al., 2003; Colder and Tanenbaum, 1999; Meador et al., 2002; Sahraie et al., 1997) and several areas higher in the processing hierarchy (Blankenburg et al., 2003; Brazdil et al., 2001; Naccache and Dehaene, 2001). The data of the present study suggest that the neural correlates of correct percepts emerge at later stages and higher levels of sensory processing, after ∼140 ms, before which stimulus-locked neuronal processing does not distinguish subsequently perceived stimuli from those escaping conscious perception. Hence our results not only support the notion that early SI activity is insufficient to distinguish trials with correct from those with incorrect responses, but also shows that processing of these trial types differs significantly starting around ∼140 ms after stimulus presentation when the signal is processed in parietal and frontal cortices (Schubert et al., 2006).
Oscillatory Power
We observed ∼15 Hz (beta band) and ∼80 Hz (gamma band) spectral power peaks 30-210 ms after stimulus onset. These oscillations reflect distinct aspects of synchronization among neuronal populations during perception, attention and memory maintenance (Cadotte et al., 2010; Uhlhaas et al., 2009) and are observed during a variety of processes, including those associated with somatosensation, WM and attention (Bauer et al., 2006; Jensen et al., 2007; Siegel et al., 2011; Spitzer and Blankenburg, 2011). Spectral power differed before and after 140 ms in all regions except LOC. SI demonstrated a decrease in power in both beta and gamma bands, whereas both pIPS and dlPFC showed gamma band increases but beta band decreases. Gamma-power increases in pIPS and dlPFC during trials with correct responses could be due to changes in attentional control, working memory maintenance and verbal encoding of decision reports (Hanslmayr et al., 2012). Gamma power increase with a concomitant beta power decrease compared to the baseline was also observed in a tactile delayed-match-to-sample task (Bauer et al., 2006). The gamma and beta power changes observed here in pIPS and dlPFC between different phases of the tactile decision-making task could be due to a change in level of top-down attentional control (Siegel et al., 2008) and a change in WM maintenance to update WM contents (Spitzer and Blankenburg, 2011).
Oscillatory Network Activity
Coherence and Granger causality spectral analyses showed that inter-areal brain synchronization and interactions during a tactile perceptual decision-making task were consistent with mediation by ∼15Hz beta band and ∼80 Hz- gamma band neural oscillations. Measures of network activity, especially those pertaining to the dlPFC in both bands, were significantly correlated with the accuracy of task performance (Figure 7 and Figure 8). These frequencies (15 Hz and 80 Hz) of oscillatory activity are close to the ones observed in an EEG study of multisensory perception (Hipp et al., 2011). The beta band network in our study included all four active nodes in somatosensory, visual, parietal and prefrontal cortex while the gamma band network excluded the visual cortical node but included the other three. A similar beta oscillatory network was observed in a somatosensory-motor task (Brovelli et al., 2004) and in a WM task (Salazar et al., 2012). The parietal and prefrontal regions showed increasing power and coherence in the gamma band over time, consistent with a well-known role of gamma oscillations in perceptual binding (Singer, 2001; Uhlhaas and Singer, 2006). The information flow at ∼15 Hz was dominantly feedforward, reflecting sensory-driven processes. On the other hand, ∼80 Hz gamma band information flow was directed in a recurrent loop from dlPFC to pIPS to SI and SI to dlPFC, implying involvement in attentional selection of relevant sensory information and sensory updating. The inter-areal and laminar neural circuitry in the brain support the natural occurrence of gamma and beta oscillatory activities and their modulations in cognitive and perceptual tasks that engage top-down attentional control signals (Buzsaki and Wang, 2012). We note that the present analysis focuses only on post-stimulus brain activity, and there was no attempt to vary subject's attention. However, the pre-stimulus and post-stimulus brain activity can be modulated by top-down attention, which has been shown in the somatosensory domain (Zhang and Ding, 2009) and in the visual domain (Bollimunta et al., 2011; Mo et al., 2011).
To summarize, the present study extends our understanding of the neocortical dynamics underlying perceptual decision making in the somatosensory domain, with regard to the time frame of averaged evoked potentials and the fast oscillatory networks that appear to organize evoked activity across widespread cortical regions. We found that fine tactile discrimination is mediated by distinct but overlapping ∼15 Hz beta and ∼80 Hz gamma band large-scale oscillatory networks. The beta-network was dominantly feedforward from somatosensory to posterior parietal to dorsolateral prefrontal cortex, similar to the propagation of average cortical activity, implying its role in accumulating and maintaining relevant sensory information and mapping to action. The gamma band network activity, occurring in a recurrent loop from the prefrontal to posterior parietal to somatosensory and back to prefrontal cortex, likely carried out attentional selection of task-relevant sensory evidence. Measures of network activity in both bands were correlated with accuracy of task performance. These findings provide important insights into the neural mechanisms that mediate fine tactile spatial discrimination of the kind that is necessary for Braille reading.
Supplementary Material
Highlights.
We investigated cortical network oscillations during tactile decision-making.
Tactile decision used here is the type that is necessary for Braille-reading.
The tactile decisions are mediated by ∼15 Hz and ∼80 Hz oscillatory networks.
Behavioral performance accuracy is correlated with these oscillatory activities.
These results contribute to unifying principles of brain functional organization.
Acknowledgments
This work was supported by by the Atlanta VAMC Rehabilitation R&D Center of Excellence. MD was supported by an NSF CAREER Award (BCS 0955037) and KS by NIH grants R01EY12440 and K24EY17332, and by the Veterans Administration. We express our sincere thanks to Mingzhou Ding for generously providing us the Matlab programs for ASEO method.
Footnotes
No conflicts of Interest
Disclosure Statement: There is no conflict of interest for any of the authors.
Publisher's Disclaimer: This is a PDF file of an unedited manuscript that has been accepted for publication. As a service to our customers we are providing this early version of the manuscript. The manuscript will undergo copyediting, typesetting, and review of the resulting proof before it is published in its final citable form. Please note that during the production process errors may be discovered which could affect the content, and all legal disclaimers that apply to the journal pertain.
References
- Allison T, McCarthy G, Wood CC, Darcey TM, Spencer DD, Williamson PD. Human cortical potentials evoked by stimulation of the median nerve. I. Cytoarchitectonic areas generating short-latency activity. J Neurophysiol. 1989;62:694–710. doi: 10.1152/jn.1989.62.3.694. [DOI] [PubMed] [Google Scholar]
- Amedi A, Jacobson G, Hendler T, Malach R, Zohary E. Convergence of visual and tactile shape processing in the human lateral occipital complex. Cereb Cortex. 2002;12:1202–1212. doi: 10.1093/cercor/12.11.1202. [DOI] [PubMed] [Google Scholar]
- Amedi A, Malach R, Hendler T, Peled S, Zohary E. Visuo-haptic object-related activation in the ventral visual pathway. Nat Neurosci. 2001;4:324–330. doi: 10.1038/85201. [DOI] [PubMed] [Google Scholar]
- Auksztulewicz R, Spitzer B, Blankenburg F. Recurrent neural processing and somatosensory awareness. J Neurosci. 2012;32:799–805. doi: 10.1523/JNEUROSCI.3974-11.2012. [DOI] [PMC free article] [PubMed] [Google Scholar]
- Bauer M, Oostenveld R, Peeters M, Fries P. Tactile spatial attention enhances gamma-band activity in somatosensory cortex and reduces low-frequency activity in parieto-occipital areas. J Neurosci. 2006;26:490–501. doi: 10.1523/JNEUROSCI.5228-04.2006. [DOI] [PMC free article] [PubMed] [Google Scholar]
- Blair RC, Karniski W. An alternative method for significance testing of waveform difference potentials. Psychophysiology. 1993;30:518–524. doi: 10.1111/j.1469-8986.1993.tb02075.x. [DOI] [PubMed] [Google Scholar]
- Blankenburg F, Taskin B, Ruben J, Moosmann M, Ritter P, Curio G, Villringer A. Imperceptible stimuli and sensory processing impediment. Science. 2003;299:1864. doi: 10.1126/science.1080806. [DOI] [PubMed] [Google Scholar]
- Bollimunta A, Mo J, Schroeder CE, Ding M. Neuronal mechanisms and attentional modulation of corticothalamic alpha oscillations. J Neurosci. 2011;31:4935–4943. doi: 10.1523/JNEUROSCI.5580-10.2011. [DOI] [PMC free article] [PubMed] [Google Scholar]
- Brazdil M, Rektor I, daniel P, Dufek M, Jurak P. Intracerebral event-related potentials to subthreshold target stimuli. Clin Neurophysiol. 2001;112:650–661. doi: 10.1016/s1388-2457(01)00463-1. [DOI] [PubMed] [Google Scholar]
- Brovelli A, Ding M, Ledberg A, Chen Y, Nakamura R, Bressler SL. Beta oscillations in a large-scale sensorimotor cortical network: directional influences revealed by Granger causality. Proc Natl Acad Sci U S A. 2004;101:9849–9854. doi: 10.1073/pnas.0308538101. [DOI] [PMC free article] [PubMed] [Google Scholar]
- Buzsaki G, Draguhn A. Neuronal oscillations in cortical networks. Science. 2004;304:1926–1929. doi: 10.1126/science.1099745. [DOI] [PubMed] [Google Scholar]
- Buzsaki G, Wang XJ. Mechanisms of gamma oscillations. Ann Rev Neurosci. 2012;35:203–225. doi: 10.1146/annurev-neuro-062111-150444. [DOI] [PMC free article] [PubMed] [Google Scholar]
- Cadotte AJ, DeMarse TB, Mareci TH, Parekh MB, Talathi SS, Hwang DU, Ditto WL, Ding M, Carney PR. Granger causality relationships between local field potentials in an animal model of temporal lobe epilepsy. J Neurosci Methods. 2010;189:121–129. doi: 10.1016/j.jneumeth.2010.03.007. [DOI] [PMC free article] [PubMed] [Google Scholar]
- Coghill RC, Gilron I, Iadarola MC. Hemispheric lateralization of somatosensory processing. J Neurophysiol. 2001;85:2602–2612. doi: 10.1152/jn.2001.85.6.2602. [DOI] [PubMed] [Google Scholar]
- Colder BW, Tanenbaum L. Dissociation of fMRI activation and awareness in auditory perception task. Cogn Brain Res. 1999;8:177–184. doi: 10.1016/s0926-6410(99)00015-4. [DOI] [PubMed] [Google Scholar]
- Corbetta M, Shulman GL. Control of goal-directed and stimulus-driven attention in the brain. Nat Rev Neurosci. 2002;3:201–215. doi: 10.1038/nrn755. [DOI] [PubMed] [Google Scholar]
- Dale AM, Sereno MI. Improved localization of cortical activity by combining EEG and MEG with MRI cortical surface reconstruction: a linear approach. J Cogn Neurosci. 1993;5:162–176. doi: 10.1162/jocn.1993.5.2.162. [DOI] [PubMed] [Google Scholar]
- Deshpande G, Hu X, Lacey S, Stilla R, Sathian K. Object familiarity modulates effective connectivity during haptic shape perception. NeuroImage. 2010;49:1991–2000. doi: 10.1016/j.neuroimage.2009.08.052. [DOI] [PMC free article] [PubMed] [Google Scholar]
- Deshpande G, Hu X, Stilla R, Sathian K. Effective connectivity during haptic perception: a study using Granger causality analysis of functional magnetic resonance imaging data. NeuroImage. 2008;40:1807–1814. doi: 10.1016/j.neuroimage.2008.01.044. [DOI] [PMC free article] [PubMed] [Google Scholar]
- Dhamala M, Rangarajan G, Ding M. Analyzing information flow in brain networks with nonparametric Granger causality. Neuroimage. 2008a;41:354–362. doi: 10.1016/j.neuroimage.2008.02.020. [DOI] [PMC free article] [PubMed] [Google Scholar]
- Dhamala M, Rangarajan G, Ding M. Estimating Granger Causality from Fourier and Wavelet Transforms of Time Series Data. Phys Rev Lett. 2008b;100 doi: 10.1103/PhysRevLett.100.018701. [DOI] [PubMed] [Google Scholar]
- Ding M, Chen Y, Bressler SL. Granger causality: basic theory and application to neuroscience. In: Schelter B, Winterhalder M, Timmer J, editors. Handbook of Time Series Analysis: Recent Theoretical Developments and Applications. Wiley-VCH; Berlin: 2006. pp. 437–459. [Google Scholar]
- Engel AK, Fries P, Singer W. Dynamics predictions: Oscillations and synchrony in top-down processing. Nat Rev Neurosci. 2001;2:704–716. doi: 10.1038/35094565. [DOI] [PubMed] [Google Scholar]
- Faes L, Nollo G, Porta A. Compensated Transfer Entropy as a Tool for Reliably Estimating Information Transfer in Physiological Time Series. Entropy. 2013;15:198–219. [Google Scholar]
- Feinstein JS, Stein MB, Castillo GN, Paulus MP. From sensory processes to conscious perception. Conscious Cogn. 2004;13:323–335. doi: 10.1016/j.concog.2003.10.004. [DOI] [PubMed] [Google Scholar]
- Forss N, Hari R, Salmelin R, Ahonen A, Hamalainen M, Kajola M, Knuutila J, Simola J. Activation of the human posterior parietal cortex by median nerve stimulation. Exp Brain Res. 1994;99:309–315. doi: 10.1007/BF00239597. [DOI] [PubMed] [Google Scholar]
- Forss N, Merlet I, Vanni S, Hamalainen M, Mauguiere F, Hari R. Activation of human mesial cortex during somatosensory target detection task. Brain Res. 1996;734:229–235. [PubMed] [Google Scholar]
- Freeman WJ, Rogers LJ, Holmes MD, Silbergeld DL. Spatial spectral analysis of human electrocorticograms including the alpha and gamma bands. J Neurosci Methods. 2000;95:111–121. doi: 10.1016/s0165-0270(99)00160-0. [DOI] [PubMed] [Google Scholar]
- Garcia-Larrea L, Lukaszewicz AC, Mauguiere F. Somatosensory responses during selective spatial attention: The N120-to-N140 transition. Psychophysiology. 1995;32:526–537. doi: 10.1111/j.1469-8986.1995.tb01229.x. [DOI] [PubMed] [Google Scholar]
- Geweke J. Measurement of linear dependence and feedback between multiple time series. J Am Stat Ass. 1982;77:304–313. [Google Scholar]
- Gold JI, Shadlen MN. Neural computations that underlie decisions about sensory stimuli. Trends Cogn Sci. 2001;5:10–16. doi: 10.1016/s1364-6613(00)01567-9. [DOI] [PubMed] [Google Scholar]
- Gold JI, Shadlen MN. The neural basis of decision making. Annu Rev Neurosci. 2007;30:535–574. doi: 10.1146/annurev.neuro.29.051605.113038. [DOI] [PubMed] [Google Scholar]
- Hamalainen M, Hari R, Ilmoniemi RJ, Knuutila J, Lounasmaa OV. Magnetoencephalography—theory, instrumentation, and applications to noninvasive studies of the working human brain. Rev Mod Phys. 1993;65:413–497. [Google Scholar]
- Hamalainen M, Ilmoniemi RJ. Interpreting magnetic fields of the brain: minimum norm estimates. Med Biol Eng Comput. 1994;32:35–42. doi: 10.1007/BF02512476. [DOI] [PubMed] [Google Scholar]
- Hanslmayr S, Staudigl T, Fellner MC. Oscillatory power decreases and long-term memory: the information via desynchronization hypothesis. Front Hum Neurosci. 2012;6:74. doi: 10.3389/fnhum.2012.00074. [DOI] [PMC free article] [PubMed] [Google Scholar]
- Heekeren HR, Marrett S, Ungerleider LG. The neural systems that mediate human perceptual decision making. Nat Rev Neurosci. 2008;9:467–479. doi: 10.1038/nrn2374. [DOI] [PubMed] [Google Scholar]
- Haider B, McCormick DA. Rapid Neocortical Dynamics: Cellular and Network Mechanisms. Neuron. 2009;62:171–189. doi: 10.1016/j.neuron.2009.04.008. [DOI] [PMC free article] [PubMed] [Google Scholar]
- Hipp JF, Engel AK, Siegel M. Oscillatory synchronization in large-scale cortical networks predicts perception. Neuron. 2011;69:387–396. doi: 10.1016/j.neuron.2010.12.027. [DOI] [PubMed] [Google Scholar]
- Jensen O, Kaiser J, Lachaux JP. Human gamma-frequency oscillations associated with attention and memory. Trends Neurosci. 2007;30:317–324. doi: 10.1016/j.tins.2007.05.001. [DOI] [PubMed] [Google Scholar]
- Junghofer M, Elbert T, Tucker DN, Rockstroh B. Statistical control of artifacts in dense array EEG/MEG studies. Psychophysiology. 2000;37:523–532. [PubMed] [Google Scholar]
- Klein-Flugge MC, Bestmann S. Time-dependent changes in human corticospinal excitability reveal value-based competition for action during decision processing. J Neurosci. 2012;32:8373–8382. doi: 10.1523/JNEUROSCI.0270-12.2012. [DOI] [PMC free article] [PubMed] [Google Scholar]
- Lindner M, Vicente R, Priesemann V, Wibral M. TRENTOOL: a Matlab open source toolbox to analyse information flow in time series data with transfer entropy. BMC Neurosci. 2011;12:119. doi: 10.1186/1471-2202-12-119. [DOI] [PMC free article] [PubMed] [Google Scholar]
- Lucan JN, Foxe JJ, Gomez-Ramirez M, Sathian K, Molholm S. Tactile shape discrimination recruits human lateral occipital complex during early perceptual processing. Hum Brain Mapp. 2010;31:1813–1821. doi: 10.1002/hbm.20983. [DOI] [PMC free article] [PubMed] [Google Scholar]
- Marois R, Yi DJ, Chun MV. The neural fate of consciously perceived and missed events in the attentional blink. Neuron. 2004;41:465–472. doi: 10.1016/s0896-6273(04)00012-1. [DOI] [PubMed] [Google Scholar]
- Mauguiere F, Merlet I, Forss N, Vanni S, Jousmaki V, Adeleine P, Hari R. Activation of a distributed somatosensory cortical network in the human brain. A dipole modelling study of magnetic fields evoked by median nerve stimulation. Part I: location and activation timing of SEF sources. Electroen Clin Neuro. 1997a;104:281–289. doi: 10.1016/s0013-4694(97)00006-0. [DOI] [PubMed] [Google Scholar]
- Mauguiere F, Merlet I, Forss N, Vanni S, Jousmaki V, Adeleine P, Hari R. Activation of a distributed somatsensory cortical network in the human brain: a dopole modelling study of magnetic fields evoked by median nerve stimulation. Part II: effects of stimulus rate, attention and stimulus detection. Electroen Clin Neuro. 1997b;104:290–295. doi: 10.1016/s0013-4694(97)00018-7. [DOI] [PubMed] [Google Scholar]
- Meador KJ, Ray PG, Echauz JR, Loring DW, Vachtsevanos GJ. Gamma coherence and conscious perception. Neurology. 2002;59:847–854. doi: 10.1212/wnl.59.6.847. [DOI] [PubMed] [Google Scholar]
- Mo J, Schroeder CE, Ding M. Attentional modulation of alpha oscillations in macaque inferotemporal cortex. J Neurosci. 2011;31:878–882. doi: 10.1523/JNEUROSCI.5295-10.2011. [DOI] [PMC free article] [PubMed] [Google Scholar]
- Naccache L, Dehaene S. The priming method: imaging unconscious repetition priming reveals an abstract representation of number in the parietal lobes. Cereb Cortex. 2001;11:966–974. doi: 10.1093/cercor/11.10.966. [DOI] [PubMed] [Google Scholar]
- Opitz B, Mecklinger A, Friederici AD. Functional Asymmetry of Human Prefrontal Cortex: Encoding and Retrieval of Verbally and Nonverbally Coded Information. Learn Memory. 2000;7:85–96. doi: 10.1101/lm.7.2.85. [DOI] [PMC free article] [PubMed] [Google Scholar]
- Peltier S, Stilla R, Mariola E, LaConte S, Hu X, Sathian K. Activity and effective connectivity of parietal and occipital cortical regions during haptic shape perception. Neuropsychologia. 2007;45:476–483. doi: 10.1016/j.neuropsychologia.2006.03.003. [DOI] [PubMed] [Google Scholar]
- Pleger B, Villringer A. The human somatosensory system: from perception to decision making. Prog Neurobiol. 2013;103:76–97. doi: 10.1016/j.pneurobio.2012.10.002. [DOI] [PubMed] [Google Scholar]
- Romo R, de Lafuente V. Conversion of sensory signals into perceptual decisions. Prog Neurobiol. 2013;103:41–75. doi: 10.1016/j.pneurobio.2012.03.007. [DOI] [PubMed] [Google Scholar]
- Roux F, Wibral M, Mohr HM, Singer W, Uhlhaas PJ. Gamma-band activity in human prefrontal cortex codes for the number of relevant items maintained in working memory. J Neurosci. 2012;32:12411–12420. doi: 10.1523/JNEUROSCI.0421-12.2012. [DOI] [PMC free article] [PubMed] [Google Scholar]
- Sadaghiani S, Hesselmann G, Friston KJ, Kleinschmidt A. The relation of ongoing brain activity, evoked neural responses, and cognition. Front Syst Neurosci Jun. 2010 Jun 23;4:20. doi: 10.3389/fnsys.2010.00020. [DOI] [PMC free article] [PubMed] [Google Scholar]
- Sahraie A, Weiskrentz L, Barbur JL, Simmons A, Williams SCR, Brammer MJ. Pattern of neuronal activity associated with conscious and unconscious processing of visaual signals. Proc Natl Acad Sci U S A. 1997;94:9406–9411. doi: 10.1073/pnas.94.17.9406. [DOI] [PMC free article] [PubMed] [Google Scholar]
- Salazar RF, Dotson NM, Bressler SL, Gray CM. Content-specific frontoparietal synchronization during visual working memory. Science. 2012;338:1097–1100. doi: 10.1126/science.1224000. [DOI] [PMC free article] [PubMed] [Google Scholar]
- Sathian K, Deshpande G, Stilla R. Neural changes with tactile learning reflect decision-level reweighting of perceptual readout. J Neurosci. 2013;33:5387–5398. doi: 10.1523/JNEUROSCI.3482-12.2013. [DOI] [PMC free article] [PubMed] [Google Scholar]
- Schubert R, Blankenburg F, Lemm S, Villringer A, Curio G. Now you feel it--now you don't: ERP correlates of somatosensory awareness. Psychophysiology. 2006;43:31–40. doi: 10.1111/j.1469-8986.2006.00379.x. [DOI] [PubMed] [Google Scholar]
- Selen LP, Shadlen MN, Wolpert DM. Deliberation in the motor system: reflex gains track evolving evidence leading to a decision. J Neurosci. 2012;32:2276–2286. doi: 10.1523/JNEUROSCI.5273-11.2012. [DOI] [PMC free article] [PubMed] [Google Scholar]
- Siegel M, Donner TH, Oostenveld R, Fries P, Engel AK. Neuronal synchronization along the dorsal visual pathway reflects the focus of spatial attention. Neuron. 2008;60:709–719. doi: 10.1016/j.neuron.2008.09.010. [DOI] [PubMed] [Google Scholar]
- Siegel M, Engel AK, Donner TH. Cortical network dynamics of perceptual decision-making in the human brain. Front Hum Neurosci. 2011;5:1–12. doi: 10.3389/fnhum.2011.00021. [DOI] [PMC free article] [PubMed] [Google Scholar]
- Singer W. Neuronal synchrony: A versatile code for the definition of relations? Neuron. 1999;24:49–65. doi: 10.1016/s0896-6273(00)80821-1. [DOI] [PubMed] [Google Scholar]
- Singer W. Consciousness and the binding problem. Ann NY Acad Sci. 2001;929:123–146. doi: 10.1111/j.1749-6632.2001.tb05712.x. [DOI] [PubMed] [Google Scholar]
- Spitzer B, Blankenburg F. Stimulus-dependent EEG activity reflects internal updating of tactile working memory in humans. Proc Natl Acad Sci U S A. 2011;108:8444–8449. doi: 10.1073/pnas.1104189108. [DOI] [PMC free article] [PubMed] [Google Scholar]
- Stilla R, Deshpande G, LaConte S, Hu X, Sathian K. Posteromedial parietal cortical activity and inputs predict tactile spatial acuity. J Neurosci. 2007;27:11091–11102. doi: 10.1523/JNEUROSCI.1808-07.2007. [DOI] [PMC free article] [PubMed] [Google Scholar]
- Stilla R, Hanna R, Hu X, Mariola E, Deshpande G, Sathian K. Neural processing underlying tactile microspatial discrimination in the blind: a functional magnetic resonance imaging study. J Vis. 2008;8:1–19. doi: 10.1167/8.10.13. [DOI] [PMC free article] [PubMed] [Google Scholar]
- Stilla R, Sathian K. Selective visuo-haptic processing of shape and texture. Hum Brain Mapp. 2008;29:1123–1138. doi: 10.1002/hbm.20456. [DOI] [PMC free article] [PubMed] [Google Scholar]
- Tomlinson SP, Davis NJ, Morgan HM, Bracewell RM. Hemispheric specialisation in haptic processing. Neuropsychologia. 2011;49:2703–2710. doi: 10.1016/j.neuropsychologia.2011.05.018. [DOI] [PubMed] [Google Scholar]
- Uhlhaas PJ, Pipa G, Lima B, Melloni L, Neuenschwander S, Nikolic D, Singer W. Neural synchrony in cortical networks: history, concept and current status. Front Integr Neurosci. 2009;3:17. doi: 10.3389/neuro.07.017.2009. [DOI] [PMC free article] [PubMed] [Google Scholar]
- Uhlhaas PJ, Singer W. Neural synchrony in brain disorders: relevance for cognitive dysfunctions and pathophysiology. Neuron. 2006;52:155–168. doi: 10.1016/j.neuron.2006.09.020. [DOI] [PubMed] [Google Scholar]
- Usher M, McClelland JL. The time course of perceptual choice: the leaky, competing accumulator model. Psychol Rev. 2001;108:550–592. doi: 10.1037/0033-295x.108.3.550. [DOI] [PubMed] [Google Scholar]
- Varela F, Lachaux JP, Rodriguez E, Martinerie J. The brainweb: Phase synchronization and large-scale integration. Nat Rev Neurosci. 2001;2:229–239. doi: 10.1038/35067550. [DOI] [PubMed] [Google Scholar]
- Wang JZ, Williamson SJ, Kaufman L. Magnetic source images determined by 934 a lead-field analysis: the unique minimum-norm least-squares estimation. IEEE T Bio-Med Eng. 1992;39:665–675. doi: 10.1109/10.142641. [DOI] [PubMed] [Google Scholar]
- Wang X, Chen Y, Ding M. Estimating Granger causality after stimulus onset: a cautionary note. Neuroimage. 2008;41:767–776. doi: 10.1016/j.neuroimage.2008.03.025. [DOI] [PMC free article] [PubMed] [Google Scholar]
- Xu L, Stoica P, Li J, Bressler SL, Shao X, Ding M. ASEO: A method for the simultaneous estimation of single-trial event-related potentials and ongoing brain activities. IEEE Trans on Biomed Eng. 2009;56:111–121. doi: 10.1109/TBME.2008.2008166. [DOI] [PubMed] [Google Scholar]
- Zhang M, Weisser VD, Stilla R, Prather SC, Sathian K. Multisensory cortical processing of object shape and its relation to mental imagery. Cogn Affect Behav Neurosci. 2004;4:251–259. doi: 10.3758/cabn.4.2.251. [DOI] [PubMed] [Google Scholar]
- Zhang Y, Ding M. Detection of a weak somatosensory stimulus: role of the prestimulus mu rhythm and its top-down modulation. J Cogn Neurosci. 2009;22:307–322. doi: 10.1162/jocn.2009.21247. [DOI] [PubMed] [Google Scholar]
- Zopf R, Giabbiconi CM, Gruber T, Müller MM. Attentional modulation of the human somatosensory evoked potential in a trial-by-trial spatial cueing and sustained spatial attention task measured with high density 128 channels EEG. Cognitive Brain Res. 2004;20:491–509. doi: 10.1016/j.cogbrainres.2004.02.014. [DOI] [PubMed] [Google Scholar]
Associated Data
This section collects any data citations, data availability statements, or supplementary materials included in this article.