
Figure 2. Event-related potentials (ERPs).
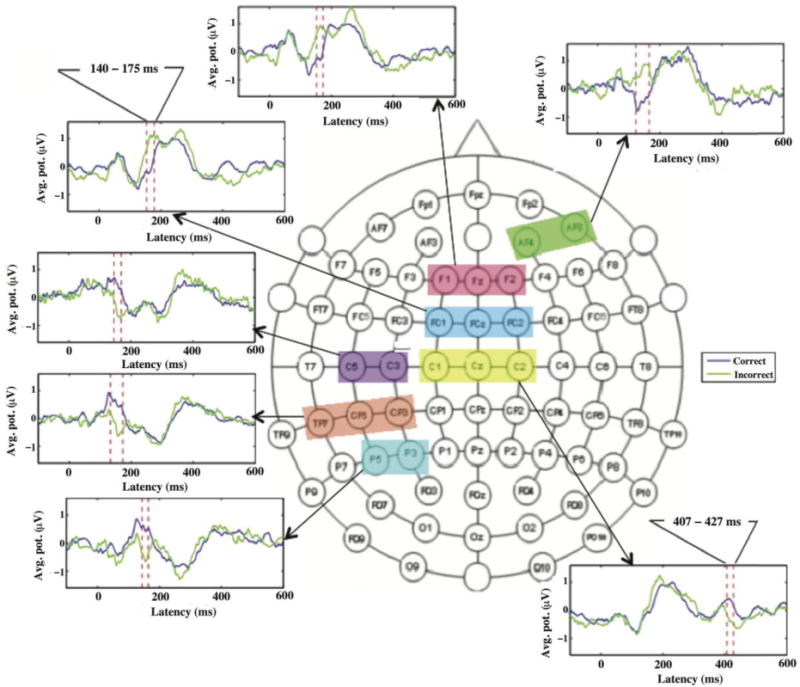
The shaded regions covering two or three labeled circles, in the 68-electrode EEG recording montage, show the locations in sensor space where ERPs differed significantly for trials with correct and incorrect responses in the timeframe 140 - 175 ms. The average waveforms, at representative sites from the shaded regions, are also shown for correct and incorrect responses.