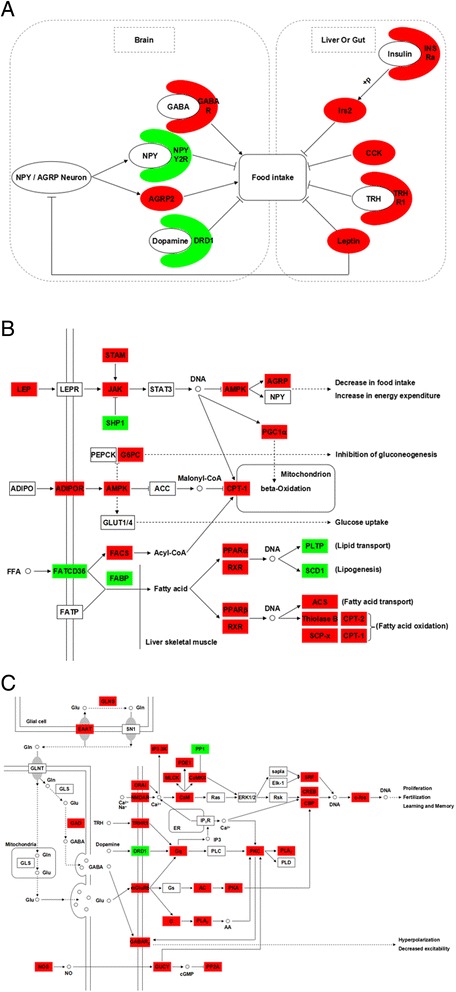
Figure 4.

Differentially expressed genes in appetite control pathway between grass carp before and after food habit transition from transcriptome analysis. The most important pathways are appetite control (A), adipocytokine signaling (B), glutamatergic synapase, calcium signaling and GABAergic synapase (C). The colors of ellipses or rectangles were shaded according to the different expression (red: the mRNA expression levels of fish in Group C were significantly higher than those in Group A (FDR ≤ 0.001, the absolute value of log2[Ratio] ≥ 1); green: the mRNA expression levels of fish in Group C were significantly lower than those in Group A (FDR ≤ 0.001, the absolute value of log2[Ratio] ≥ 1)). All of these genes were not differentially expressed between Groups A and B.
