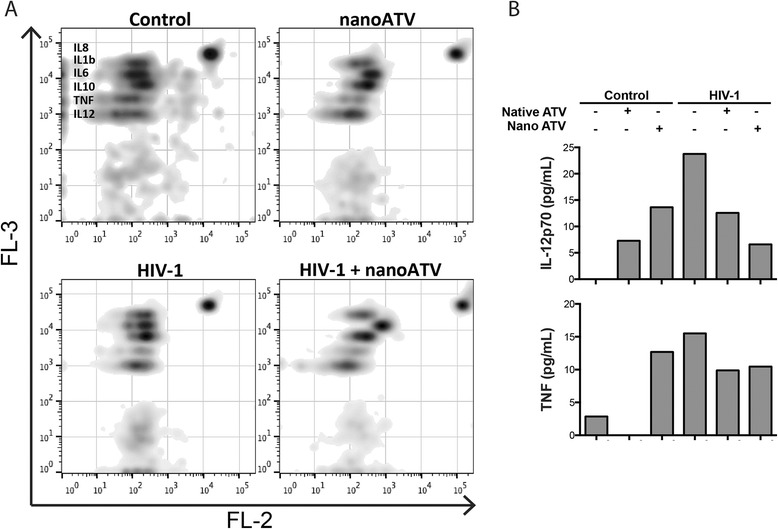
Figure 7.

NanoATV regulation of cytokine profiles in HIV-1 infected MDM. MDM were treated with 100 μM native ATV or nanoATV and infected with HIV-1 at day 0, 5 or 10 post-drug treatment. Untreated, uninfected cells were used as controls. After 24 hours of viral infection, cell culture media were collected and analyzed using a cytokine bead array. (A) Density plots show expression of IL-12, TNF, IL-10, IL-6, IL-1β and IL-8 for control, treated, HIV-1 infected and treated infected MDM. Cytokine levels were detected by FACSArray cytometer and data was plotted using FlowJo (version 10.7) software. (B) Levels of IL-12 and TNF after treatment and infection are shown. Data are analyzed using FCAP software and values of cytokine expression were expressed as pg/mL.
