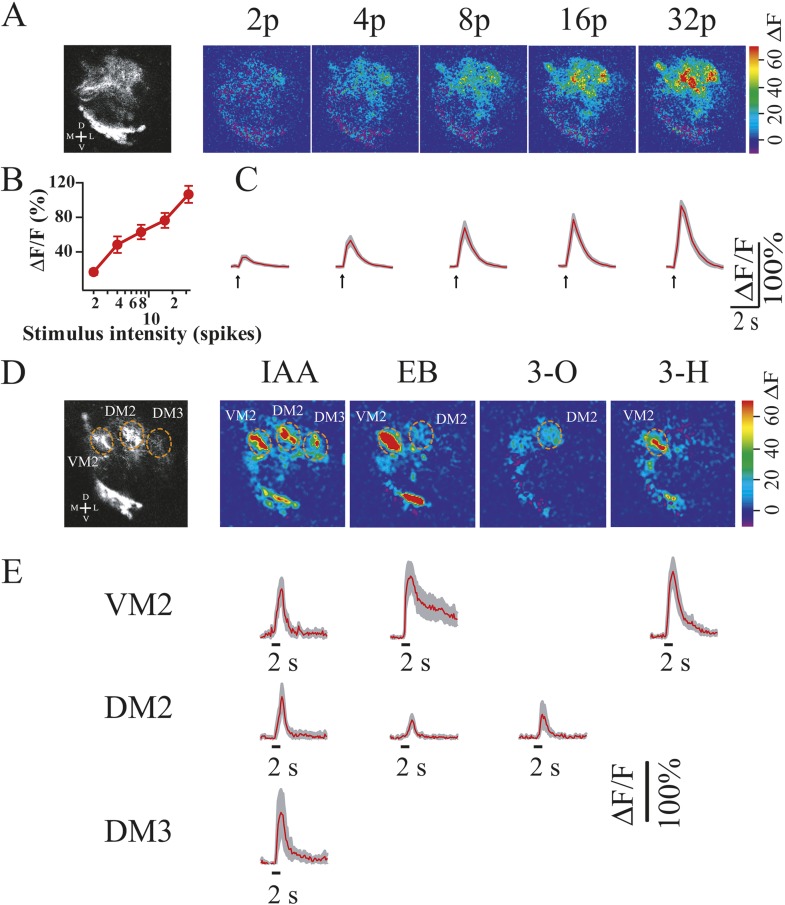
Figure 11. The otd−/− transformed LALv1 lineage has functional synapses in the AL and can respond to odour stimulation.
(A) Two-photon calcium imaging from the otd−/− LALv1 neurons in response to electrical stimulation of the antennal nerve. Gray-scale image shows average pre-stimulation fluorescence of one transformed lineage. Colour images show fluorescence changes in response to different numbers of electrical stimulation (duration, 1 ms; amplitude, 10 V; frequency, 100 Hz). Graph in B shows peak amplitude of ΔF/F against the number of stimulations. Error bars represent S.E.M. n = 5. (C) Average traces that plot ΔF/F over time at different stimulus intensities. Shaded region in each trace represents S.E.M. (D) Two-photon calcium imaging from the otd−/− LALv1 neurons in response to odour stimulation of the antenna. Gray-scale image shows the structure of the transformed lineage and three identifiable glomeruli. The colour images show glomerular activation patterns evoked by isoamyl acetate (IAA), ethyl butyrate (EB), 3-octanol (3-O) and 3-heptanol (3-H). IAA activated VM2, DM2 and DM3. EB activated both VM2 and DM2. 3-O and 3-H activated DM2 and VM2, respectively. (E) Average traces that plot ΔF/F over time in VM2, DM2 and DM3. The shaded region in each trace represents S.E.M. n = 3–5. The false colour scales (ΔF) and scale bars are shown at the right of each panel. Genotype: FRT19A, otdYH13/FRT19A,Tub-Gal80,hsFLP;GH146-Gal4,UAS-GCaMP3/GH146-Gal4,UAS-GCaMP3.

