Figure 1.

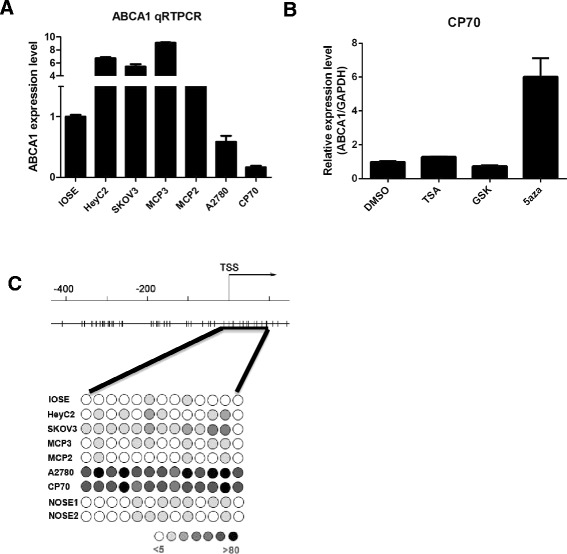
ABCA1 expression and methylation level in IOSE cells and ovarian cancer cell lines. (A) Total RNA was isolated from ovarian cells and converted into cDNA for amplification with specific primers for ABCA1. The relative level of expression after quantitative real-time RT-PCR was compared to IOSE cells (set as one fold). Each bar represents mean ± SD. (B) CP70 cells were treated with TSA (0.5 μM, 12 h), GSK343 (1 μM, 3 days), or 5aza (0.5 μM, 3 days). The expression level of ABCA1 was determined by RT-PCR. Treatment of 5aza, but not TSA or GSK, resulted in robust re-expression of ABCA1 in CP70 cells. Each bar represents mean ± SD. (C) The methylation status of the ABCA1 promoter and TSS region was analyzed by bisulfite pyro-sequencing from −90 to +190 (black line underneath). The upper panel shows the ABCA1 promoter and TSS region and the corresponding CpG sites (vertical bar), and the lower panel illustrates DNA methylation at the interrogated CpG site (circle) in IOSE cells, two NOSE samples, and ovarian cancer cell lines with intensity of gray color indicating methylation level.
