Figure 3.

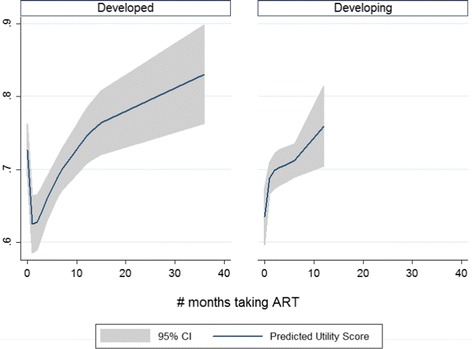
Predicted utility score and 95% confidence interval by study settings based on the best fitting fractional polynomial model.

Predicted utility score and 95% confidence interval by study settings based on the best fitting fractional polynomial model.