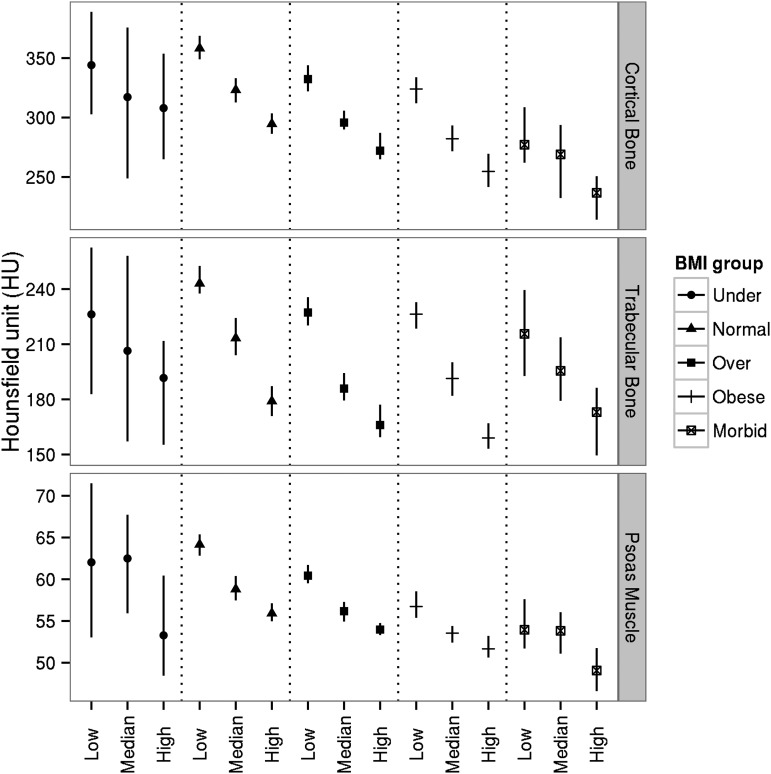
FIGURE 3.
Medians of muscle attenuation and bone densities for different BMI categories and VAT area tertiles (we divided subjects into 5 groups according to standard BMI cutoffs as follows (in kg/m2): <18.5, 18.5–24.9, 25–29.9, 30–39.9, and ≥40). Within each BMI category, we further divided subjects into 3 groups according to tertiles of VAT areas. In each of these 15 subgroups, we presented median Hounsfield units of psoas muscle attenuation, cortical BMD, and trabecular BMD and respective 95% CIs. Low, median, and high represent 3 VAT-area tertile groups. BMD, bone mineral density; VAT, visceral adipose tissue.

