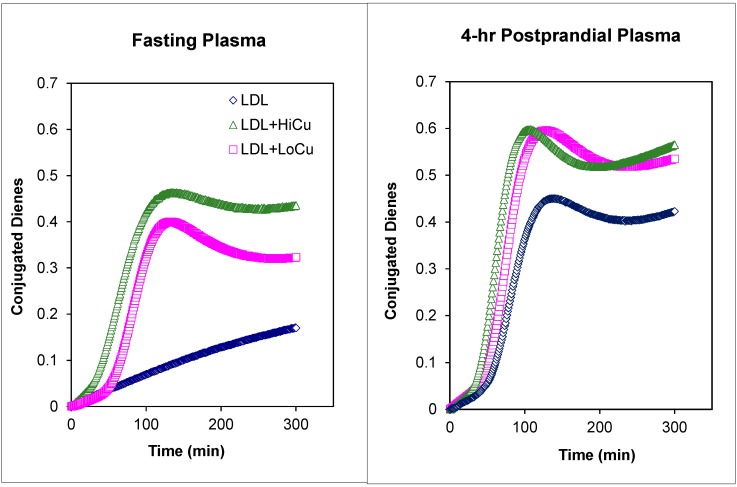
Figure 4.
Meal-induced changes in oxidative susceptibility of LDL isolated from fasting versus LDL isolated from postprandial plasma of a patient with T2DM under dietary management. Blue symbols: LDL in the absence of Cu2+ as catalyst. Green symbols: LDL in the presence of high Cu2+ concentrations (9.0 mmol Cu2+ per 45 mg of LDL-C). Pink symbols: LDL in the presence of low Cu2+ concentrations (4.5 mmol Cu2+ per 45 mg of LDL-C).

