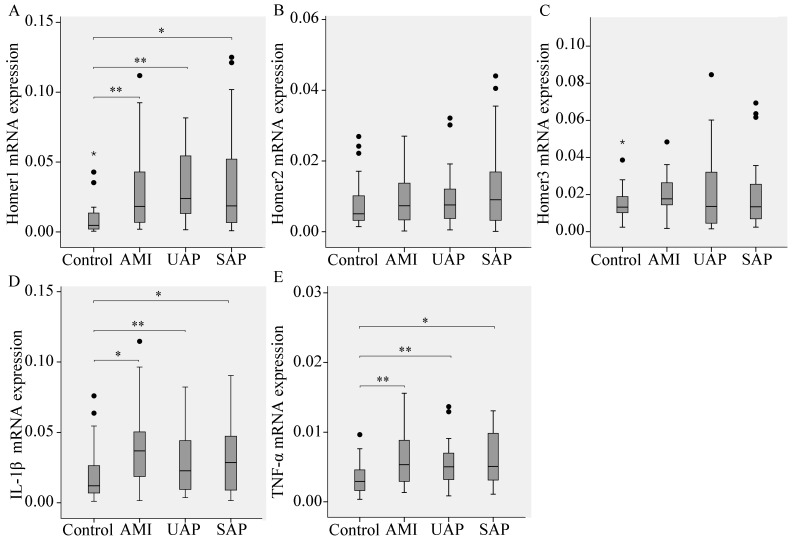
Figure 1.
The expression of Homer1 (A); Homer2 (B); Homer3 (C) and the pro-inflammatory cytokine interleukin-1β (IL-1β) (D); and tumor necrosis factor-α (TNF-α) (E) in peripheral blood leukocytes from CAD patients. Results are shown as median box and whisker plots. Statistical differences in relative expression between CAD patients and controls are indicated as asterisks: * (p value, Mann-Whitney test). * p < 0.05, ** p < 0.01 vs. Control. “•” represents outliers; “*” represents extreme values.

