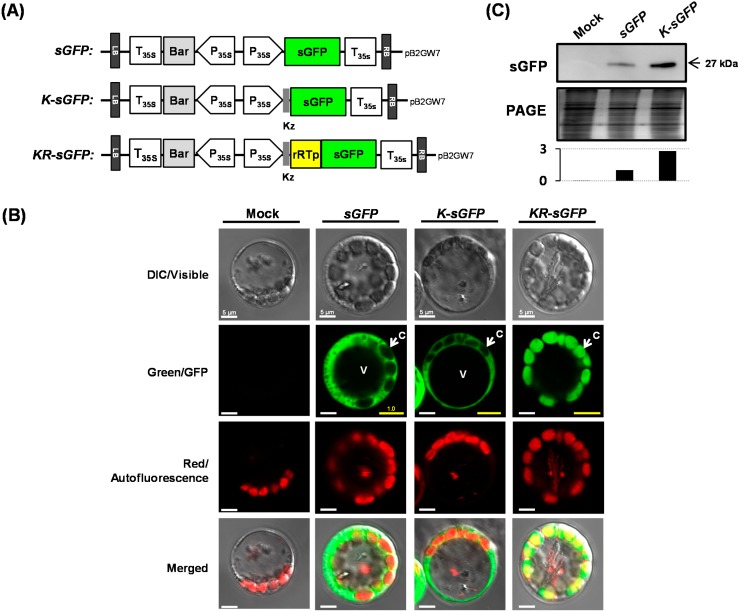
Figure 1.
Subcellular localization and expression efficiency of sGFPs in rice protoplasts. (A) Three kinds of sGFP chimera were cloned into a pB2GW7 vector to construct sGFP, K-sGFP, and KR-sGFP for use in PEG-mediated transfection into rice protoplasts. Kz: Kozak sequence; rRTp: a transit peptide of rice RuBisCo small subunit; (B) Individual and merged images of GFP, chlorophyll autofluorescence, and visible protoplasts. C: chloroplast; V: vacuole. The images were acquired at 630× magnification using a confocal microscope. The yellow signals are the merged image of the green fluorescent signals from the sGFP proteins; the red fluorescent signals from chlorophyll in the chloroplasts. The PEG-transformed protoplasts with no plasmid were used as a mock sample. The yellow scale bars on the images show the mean intensity ratio of the green fluorescence signals (for 105 pixels), analyzed by a Histogram tool, and the white scale bars mean 5 μm and (C) The expression efficiency of proteins was compared using western blot analysis. Polyclonal rabbit antibody against sGFP was used at a titer of 1:5000 and the image of PAGE gel was used to show relative quantities of the loaded proteins. The graph shows the relative band intensities that were quantified using LAS4000 software.

