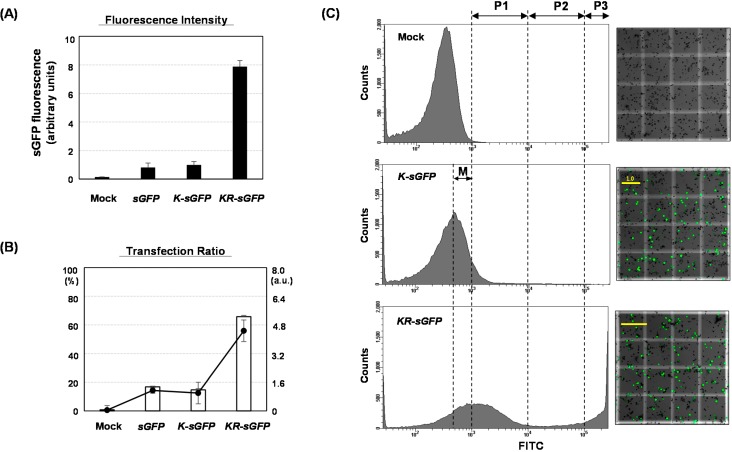
Figure 2.
Comparative analysis of FCA using rice protoplasts among sGFP, K-sGFP and KR-sGFP constructs. Rice protoplasts were transfected with 5 μg plasmids of sGFP, K-sGFP, and KR-sGFP constructs. The FCAs were performed using single live cells gated by the side/forward scattering. (A) The fluorescence intensities were analyzed using the fluorescein isothiocyanate (FITC-A) channel of the flow cytometer and normalized by the average fluorescence intensity of the K-sGFP construct. The results are presented in arbitrary units; (B) The ratio of protoplasts with a fluorescence intensity exceeding the threshold value (103) to the gated protoplasts was calculated on FCA. The left axis shows the percentage of the transfected protoplasts expressing sGFP and the right axis shows their arbitrary results. The error bars show the SEM (standard error of the mean) for the data acquired from three independent transfections. Mock samples were prepared by PEG-transfection with no plasmid DNA and (C) Flow cytometry histograms (left panels) and the images of hemocytometer measurements (right panels). The fluorescence intensity on FITC was partitioned into P1 (103–104), P2 (104–105), and P3 (>105) subpopulations, and M means “the missing population”. For a hemocytometer analysis, 10 μL of the transformed protoplasts was mounted on a hemocytometer, and were photographed using the DIC and FITC-A channels of a confocal microscope (200× magnification). The merged images of one square (1 mm2) on the hemocytometer were shown. The sGFP-expressing cells were identified as the green fluorescent signals, and the yellow scale bars on the images show the mean intensity ratio (for 106 pixels) of the green fluorescence, analyzed by a Histogram tool.

