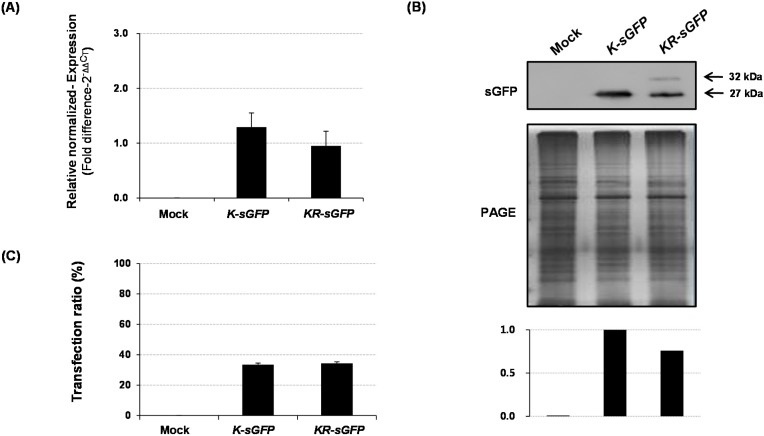
Figure 4.
Comparison of K-sGFP and KR-sGFP constructs based on non-FCA analysis. (A) The mRNA transcripts of sGFP and rRTp-sGFP were compared using real-time PCR. The rice ubiquitin gene was used as an internal reference for quantitative normalization; (B) The expression efficiency of proteins compared by western blot analysis. Polyclonal rabbit antibody against sGFP was used at a titer of 1:5000 and the image of PAGE gel was used to show relative quantities of the loaded proteins. The graph shows the relative band intensities quantified using LAS4000 software and (C) The ratio of protoplast cells expressing sGFP proteins was analyzed by hemocytometer measurements. A volume of 10 μL of the transformed protoplasts was mounted on a hemocytometer and the images were obtained using the DIC and FITC-A channels of a confocal microscope (200× magnification). The sGFP-expressing cells were identified as the green fluorescent signals. The error bars show the SEM of data acquired from three independent transfections. Control samples were prepared by PEG transfection with no plasmid DNA.

