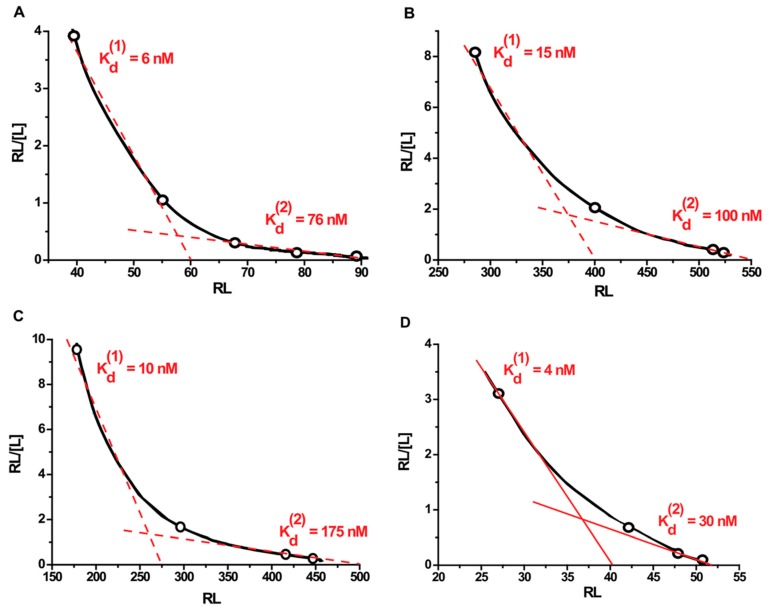
Figure 5.
Scatchard plots of binding of proteins with gold nanoparticles. Graph (А) is for bovine serum albumin (BSA); (B) is for Kunitz-type soybean trypsin inhibitor (STI); (C) is for recombinant streptococcal protein G (protein G); and (D) is for human immunoglobulin G (IgG). Kd(1) is the equilibrium dissociation constant for conjugates at protein concentrations below the saturation point, Kd(2) is the equilibrium dissociation constant for conjugates at a protein concentration close to the saturation point. [L] is the concentration of free protein, and RL is the number of protein molecules bound to a single gold nanoparticle.

