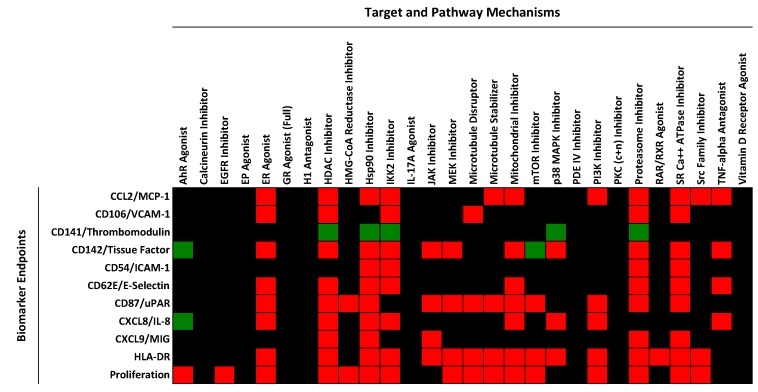
Figure 1.
Heat map showing the effect of mechanisms on the cell surface protein expression levels of biomarker endpoints in the BioMAP 3C system. Mechanisms causing an increase in the level of the indicated biomarker are shown in green, and mechanisms resulting in decreased levels are shown as red. Black indicates that the levels were unchanged (no missing data). Data were generated from multiple compounds and an average profile representing the mechanism class was generated. The data used to generate this figure are taken from reference [21] and are included for convenience in Supplemental Table S1.

