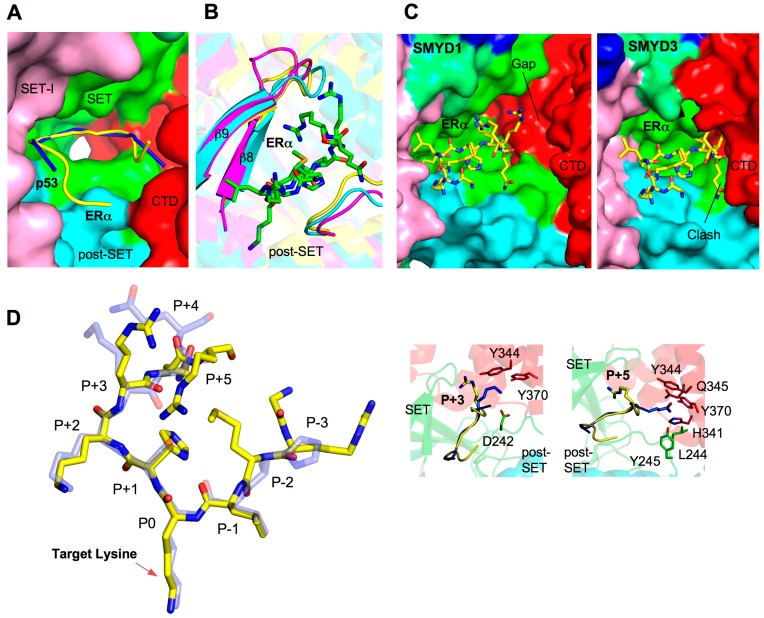
Figure 4.
Substrate binding site. (A) Surface representation of SMYD2 substrate binding site. The surface is colored according to domains. ERα and p53 peptides are depicted by ribbons and colored in yellow and blue respectively; (B) Superposition of the substrate binding clefts. SMYD residues are represented by ribbons and colored according to the scheme in Figure 1C. ERα peptide is shown in balls-and-sticks colored in green; (C) Surface representation of the substrate-binding site of SMYD1 and SMYD3. The ERα peptide, represented by sticks, is modeled by superposition with the N-terminal lobe of SMYD2; and (D) Superposition of the SMYD2-bound ERα (yellow; PDB code: 4O6F) and p53 peptides (light blue; PDB code: 3TG5). Position 0 refers to the target lysine. Detailed structural and binding differences at position +3 and +5 are shown in callout boxes. Peptide-interacting SMYD2 residues are colored according to domains.

