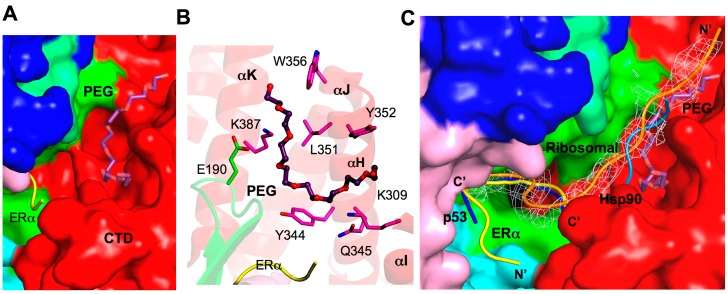
Figure 7.
Additional substrate binding site. (A) Surface representation of the PEG binding site in SMYD2. PEG is depicted by sticks with the carbon atoms colored in purple. ERα peptide is displayed as ribbon and colored yellow; (B) Putative PEG interacting residues. SMYD2 residues are colored according to domains. ERα residues are shown in yellow. PEG is represented in the same way as in (A); and (C) Comparison of the binding sites of ERα (yellow), p53 (blue), PEG (purple), Hsp90 (light blue), and a ribosomal peptide (orange). The ribosomal peptide is overlaid with 2Fo−Fc omit map calculated at 2.8 Å and contoured at 1.5σ. The Hsp90 peptide is modeled by superposition of the SMYD2 CTD and Hop1 TPR.

