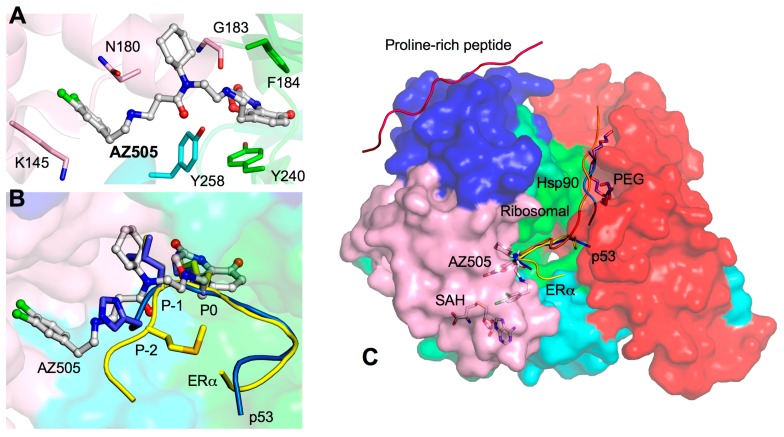
Figure 8.
AZ505-bound SMYD2 structure. (A) Interactions between AZ505 and SMYD2. AZ505 is depicted by balls-and-sticks with the carbon atoms colored in white. SMYD2 residues are depicted by sticks colored according to domains; (B) Comparison of the binding sites of ERα, p53, and AZ505. The ERα and p53 peptides are depicted by sticks and colored in yellow and blue. AZ505 is represented in the same way as in (A); and (C) Surface representation of SMYD2–ERα structure illustrates potential drug targeting sites: ERα (yellow), p53 (blue), PEG (purple), Hsp90 (light blue), the ribosomal peptide (orange), and proline-rich peptide (hot pink). SAH and AZ505 are depicted by sticks.

