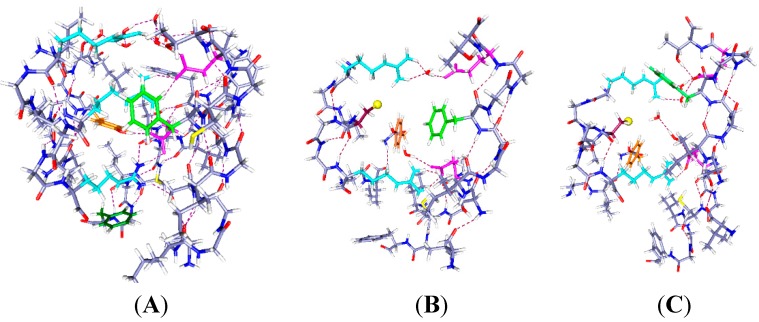
Figure 1.
The central part of the voltage sensing domain, side view from R297 (top) to R303 (bottom) on the S4 TM segment, and nearby residues on S1, S2 and S3. Most of the protein is shown as dark blue (N) and gray (C). Arginines 297 and 303 are light blue, tyrosine (Y266) is orange, phenylalanine F233 green; in (B,C), C300 has the sulfur as a large yellow sphere. Glutamate side chains are magenta. The water molecules are red (oxygen) and white (hydrogen). Hydrogen bonds are dashed lines. A preliminary version of this figure was posted on arXiv [38]). Parts (B,C) are optimized with HF/6-31G** from a starting position that allowed salt bridges to be maintained where possible; part (A) was similarly optimized directly from the 3Lut structure, and the changes are small.

