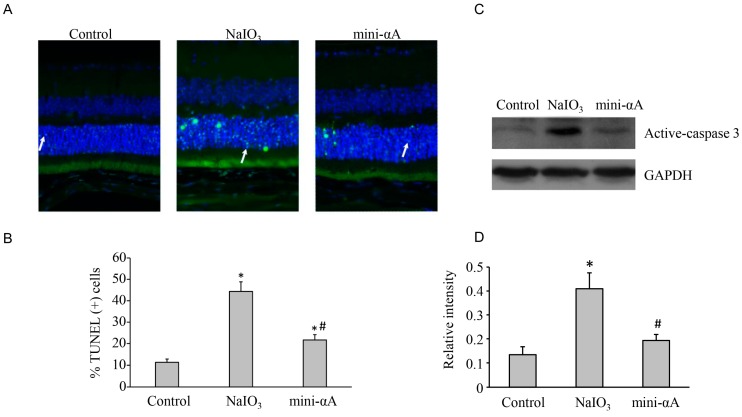
Figure 3.
TUNEL assay was performed 3 days after the establishment of the mouse model of NaIO3-induced retinal degeneration. (A) Almost no TUNEL-positive cells were detected in normal control group; a large number of TUNEL-positive cells were found in the external nuclear layer in the retinas of NaIO3 group (white arrow); several TUNEL-positive cells were observed in the external nuclear layer in mini-αA group (white arrow), but much less than those observed in NaIO3 group. Magnification: 400×; (B) Quantification of dead cells by TUNEL assay from at least five independent experiments. TUNEL-positive cells were counted and data were expressed as percent of total death cells; (C) Western blot analysis of caspase expression levels in each subgroup; (D) Quantification of band intensity of caspase from three independent experiments on (C). * p < 0.05 vs. Control; # p <0.05 vs. NaIO3.

