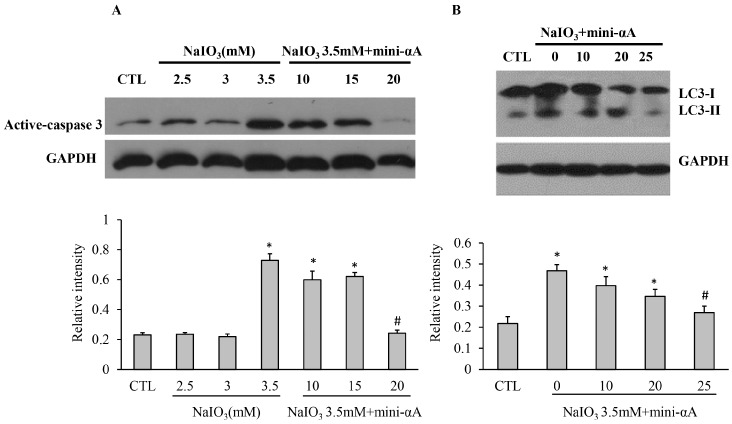
Figure 4.
Western blotting was performed to detect caspase and 3LC3- I/II protein expression levels of each subgroup. (A) Caspase expression levels of each subgroup and quantification of the band intensity of caspase from there independent experiments; (B) 3LC3- I/II protein expression levels in each group and quantification of the band intensity from there independent experiments. GAPDH was used as the internal control. CTL: normal ARPE-19 cells; NaIO3: cells induced with NaIO3; NaIO3 + mini-αA: cells treated first with mini-αA and then with NaIO3. * p < 0.05 vs. Control; # p < 0.05 vs. NaIO3.

