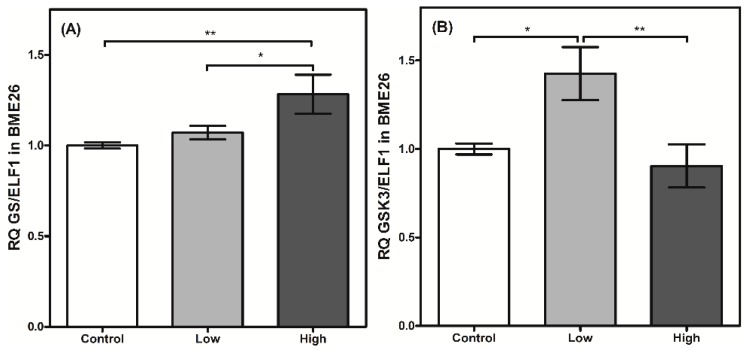
Figure 5.
Glycogen metabolism synthesis has a transcriptional control in BME26 cells. Transcriptional analysis of glycogen synthase (A) and glycogen synthase kinase 3 (B) in embryonic Rhipicephalus microplus cells (BME26) in response to glucose treatment. Control: cells maintained with 50 mM of glucose; Low: cell maintained without glucose addition; and High: cells maintained with 100 mM of glucose. The experiment was performed with three independent biological samples in three experimental replicates each (* p < 0.05; ** p < 0.001, ANOVA).

