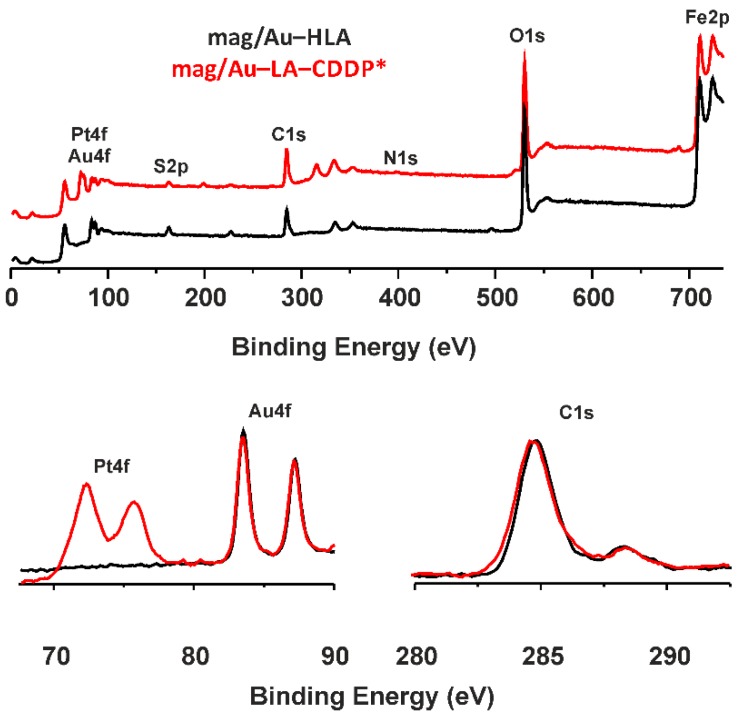
Figure 4.
The results of the XPS spectroscopy of the mag/Au–LA–CDDP* nanosystems (red lines) and their comparison with mag/Au–HLA (black lines), given for the 0–750 eV region (top) with the details of the Pt4f/Au4f region at 67.5–90 eV (bottom left) and C1s region in the 280–295 eV range (bottom right).

