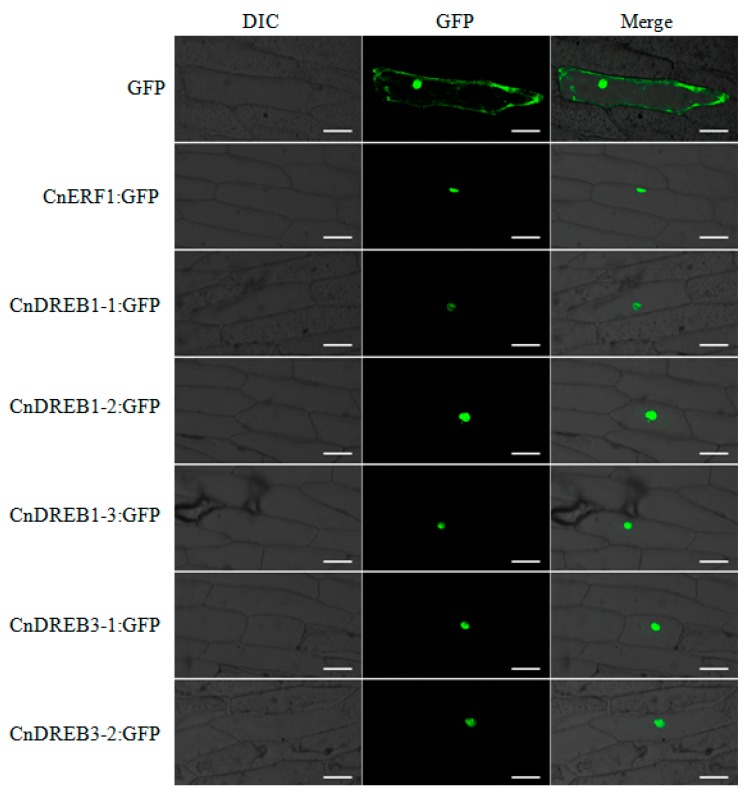
Figure 2.
Localization of transiently expressed CnAP2/ERF TF products in onion epidermal cells. The upper row shows the control 35S::GFP signal, and each of the lower rows the signal from one of the 35S::CnAP2/ERF-GFP transgenes. The left panel shows bright field images, the middle one green fluorescence signals detected at 488 nm and the right one the merged Green Fluorescent Protein (GFP) and bright field images. Bar: 50 μm.

