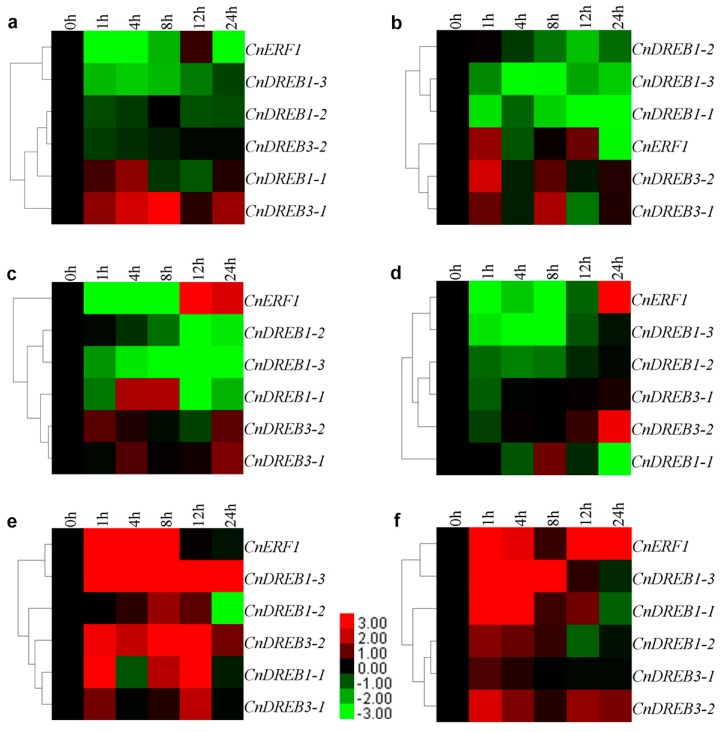
Figure 4.
Differential transcript abundance of the CnAP2/ERF TFs in response to (a) salinity stress; (b) abscisic acid (ABA) treatment; (c) salicylic acid (SA) treatment; (d) jasmonic acid (JA) treatment; (e) low temperature stress; and (f) wounding. Green cells indicate suppressed and red ones enhanced levels of transcript abundance compared to the relevant control. Black cells represent no significant change of transcript abundance.

