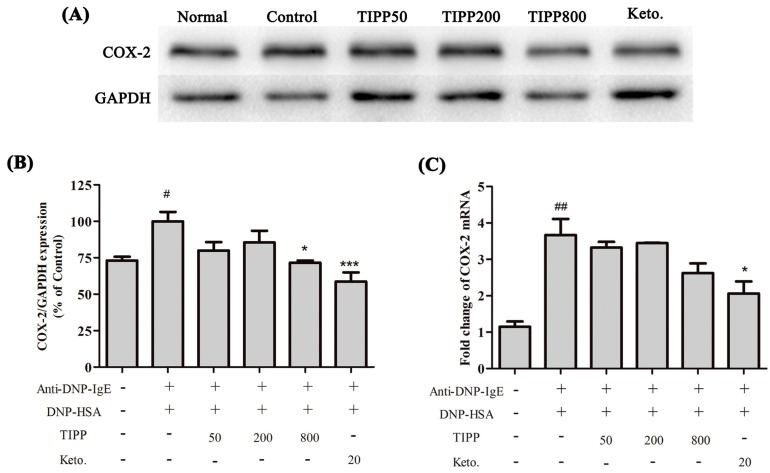
Figure 7.
Western blot diagram (A) and statistical analysis (B) of COX-2 (cyclooxygenase-2) expression in IgE-antigen complex stimulated RBL-2H3 cells; (C) represents the statistical analysis of COX-2 mRNA levels in IgE-antigen complex stimulated RBL-2H3 cells. The Western blot diagram is a representative of three independent experiment diagrams with similar results. Each lane was loaded with 20 μg of total protein. Results are expressed as mean ± SEM (n = 3). Compared with normal group, # p < 0.05, ## p < 0.01; compared with control group, * p < 0.05, *** p < 0.001.

