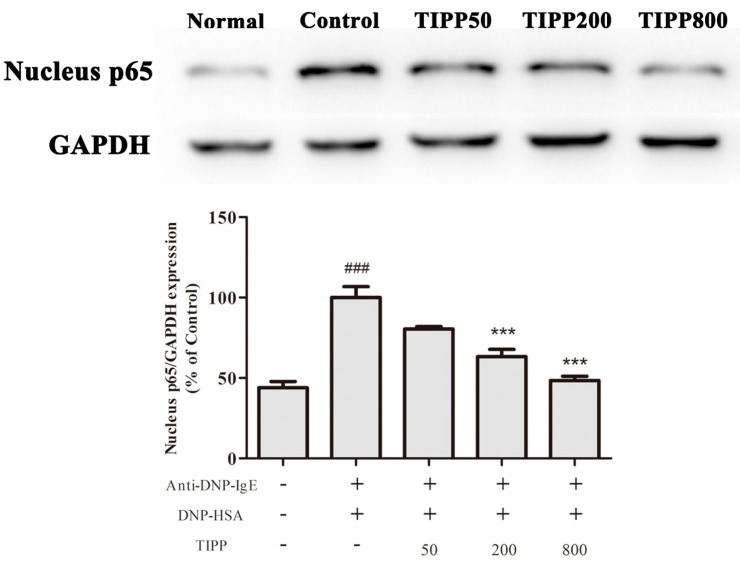
Figure 9.
Effect of TIPP on the nuclear translocation of NF-κB. The Western blot diagram is a representative of three independent experiment diagrams with similar results. Each lane was loaded with 20 μg of total protein. Results are expressed as mean ± SEM (n = 3). Compared with Normal group, ### p < 0.001; compared with Control group, *** p < 0.001.

