
Figure 2.
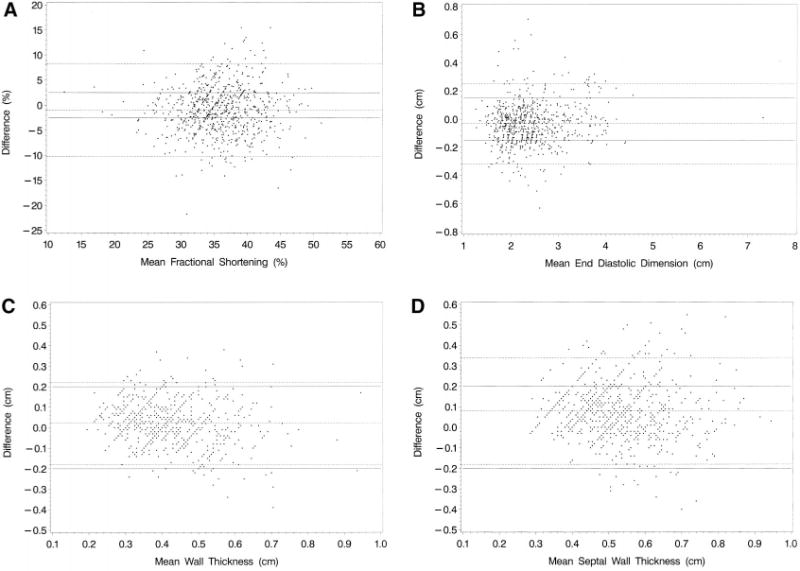
A, Difference (central minus local) between central and local measurements of fractional shortening (%) from 724 echocardiograms against mean fractional shortening. B, Difference (central minus local) between central and local measurements of end-diastolic dimension (cm) from 724 echocardiograms against mean end-diastolic dimension. C, Differences (central minus local) between central and local measurement of end-diastolic wall thickness (cm) from 735 echocardiograms against mean end-diastolic wall thickness. D, Difference (central minus local) between central and local measurements of end-diastolic septal wall thickness (cm) from 726 echocardiograms against mean end-diastolic septal wall thickness. Dotted lines are mean difference and 95% prediction interval; solid lines, clinically acceptable limits.