
Figure 3.
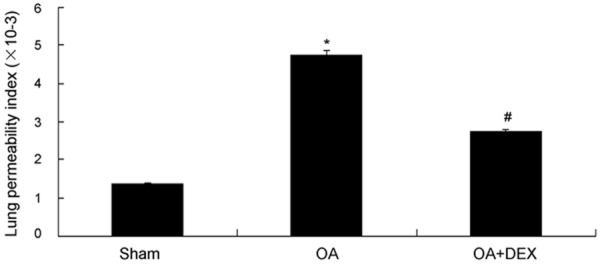
Comparison of lung permeability index (LPI) between three groups, *P < 0.01 compared with sham operated; #P < 0.01 compared with OA treated.
Official websites use .gov
A
.gov website belongs to an official
government organization in the United States.
Secure .gov websites use HTTPS
A lock (
) or https:// means you've safely
connected to the .gov website. Share sensitive
information only on official, secure websites.
Comparison of lung permeability index (LPI) between three groups, *P < 0.01 compared with sham operated; #P < 0.01 compared with OA treated.