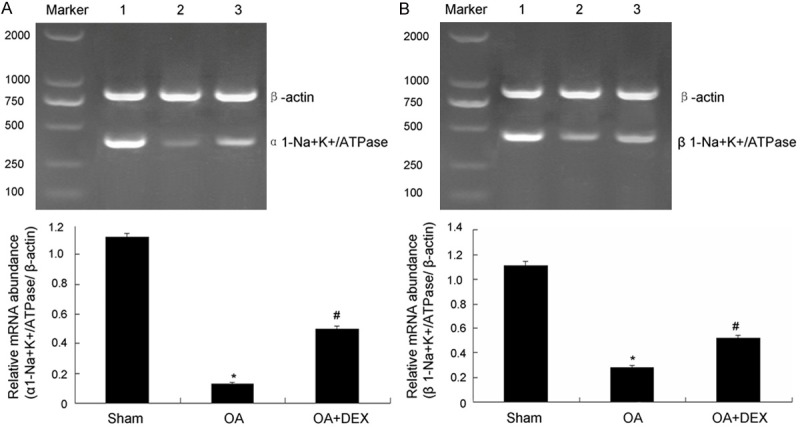
Figure 6.

Measurement of ATPase mRNA level. A. Measurement of α1-Na+-K+-ATPase mRNA level in lung tissue and the statistical analysis. B. Measurement of β1-Na+-K+-ATPase mRNA level in lung tissue and the statistical analysis. 1: Sham operated group; 2: OA treated group; 3: OA-DEX (dexamethasone) treated group. *P < 0.01 compared with sham operated; #P < 0.01 compared with OA treated.
