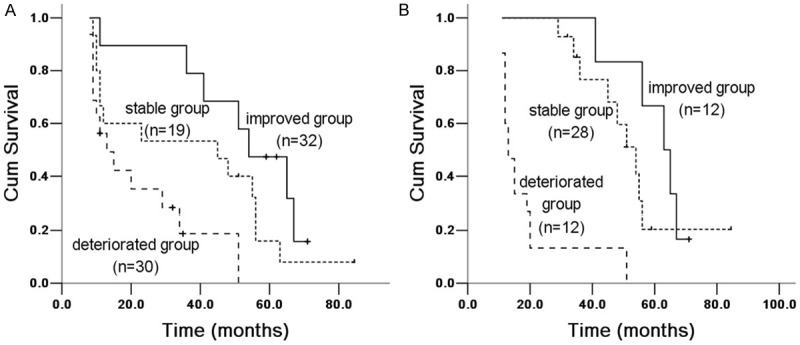
Figure 4.

Kaplan Meier survival analysis of IPF patients with DLCO% between 6 and 12 months groups. A. 6 months group: improved and stable group (X 2 = 21.455, P = 0.00004), improved and deteriorated group (X 2 = 7.632, P = 0.006); stable and deteriorated group (X 2 = 4.016, P = 0.045). B. 12 months group: improved and stable group (X 2 = 3.025, P = 0.082), improved and deteriorated group (X 2 = 23.551, P = 0.00001); stable and deteriorated group (X 2 = 13.781, P = 0.00002).
