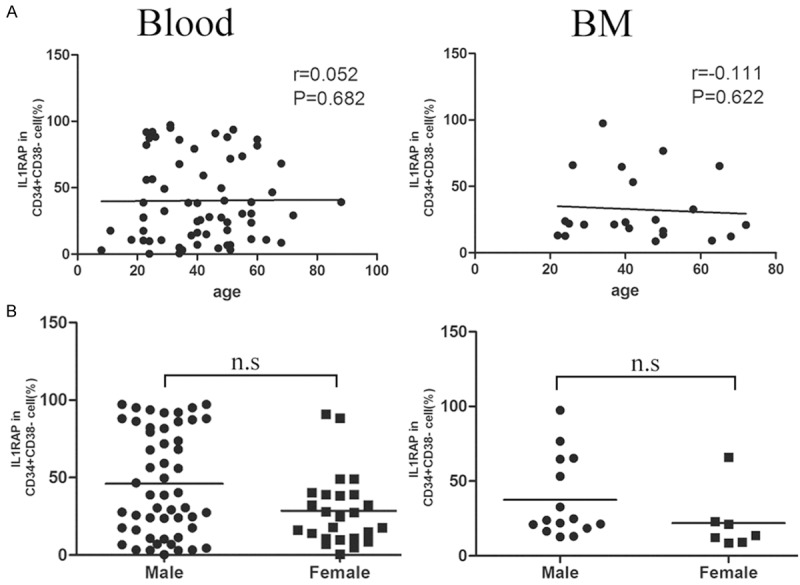
Figure 6.

IL1RAP expression in CD34+CD38- subsets was not correlated with age or gender. A. Correlation between the percentage of IL1RAP+CD34+CD38- cells and age in patients’ Blood and BM. Each symbol represents one data point from one patient. The lines show trend line. B. The correlation of IL1RAP expression in CD34+CD38- cells from peripheral blood and bone marrow with gender was analyzed respectively. Horizontal bars represent mean value; n.s means P > 0.05.
