
Figure 1.
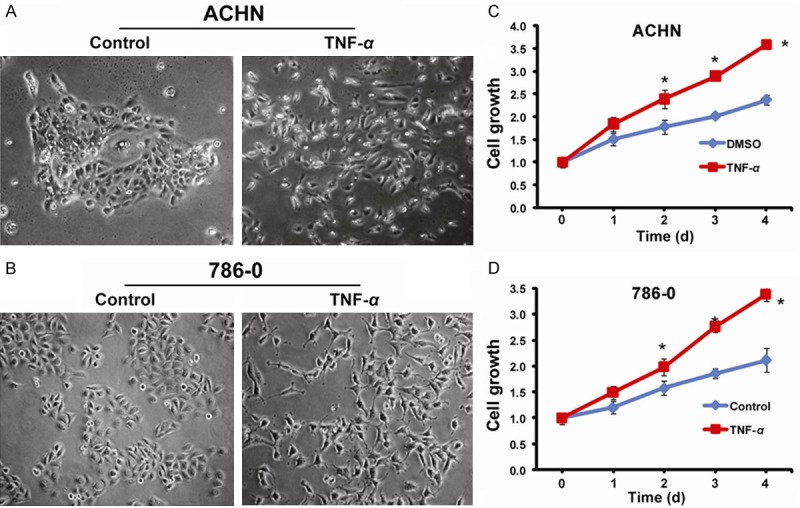
Morphological changes and growth curves after TNF-α treatment. A: Untreated ACHN and treated ACHN, at 4 days 50 ng/ml TNF-α treatment; B: Untreated 786-0 and treated 786-0, at 4 days 50 ng/ml TNF-α treatment; C: Growth curves of untreated and treated ACHN; D: Growth curves of untreated and treated 786-0.