
Figure 4.
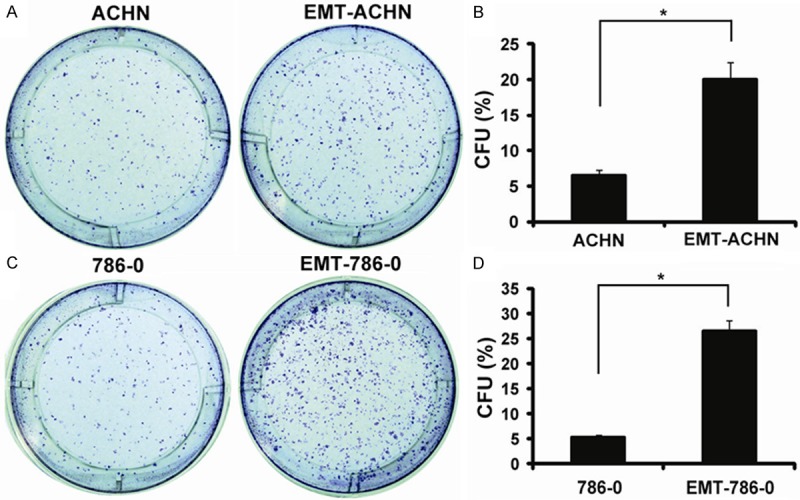
Colony efficiency analyses. A: Photographs of colonies from ACHN and EMT-ACHN cells; B: The colony number was counted and the data were presented as CFU (%) respect to cell number seeded; C: Photographs of colonies from 786-0 and EMT-786-0 cells; D: The colony number was counted and the data were presented as CFU (%) respect to cell number seeded. *P < 0.05.