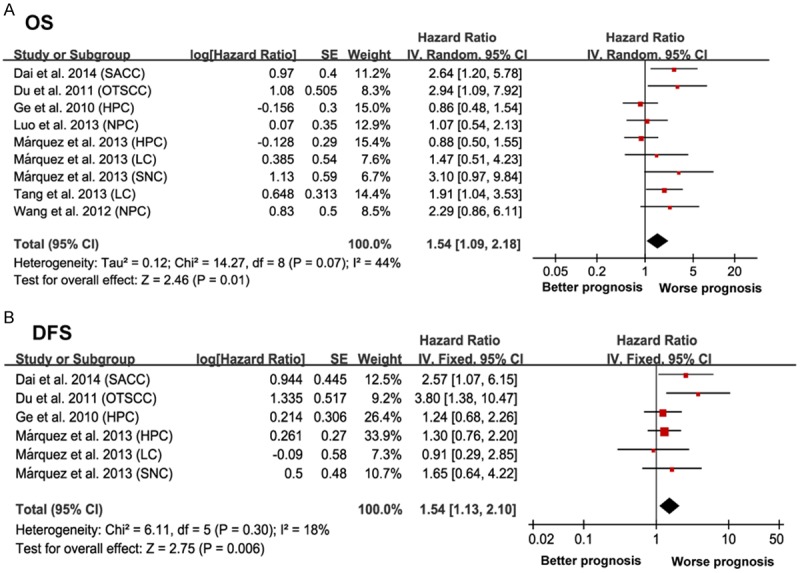
Figure 2.

Forrest plots evaluating association between increased SOX2 expression and clinical outcomes in HNC. A. Forrest plot to assess the overall effect of SOX2 on OS in HNC patients. B. Forrest plot to assess the overall effect of SOX2 on DFS in HNC patients. Results are presented as individual and pooled hazard ratio (HR), and 95% confidence interval (CI).
