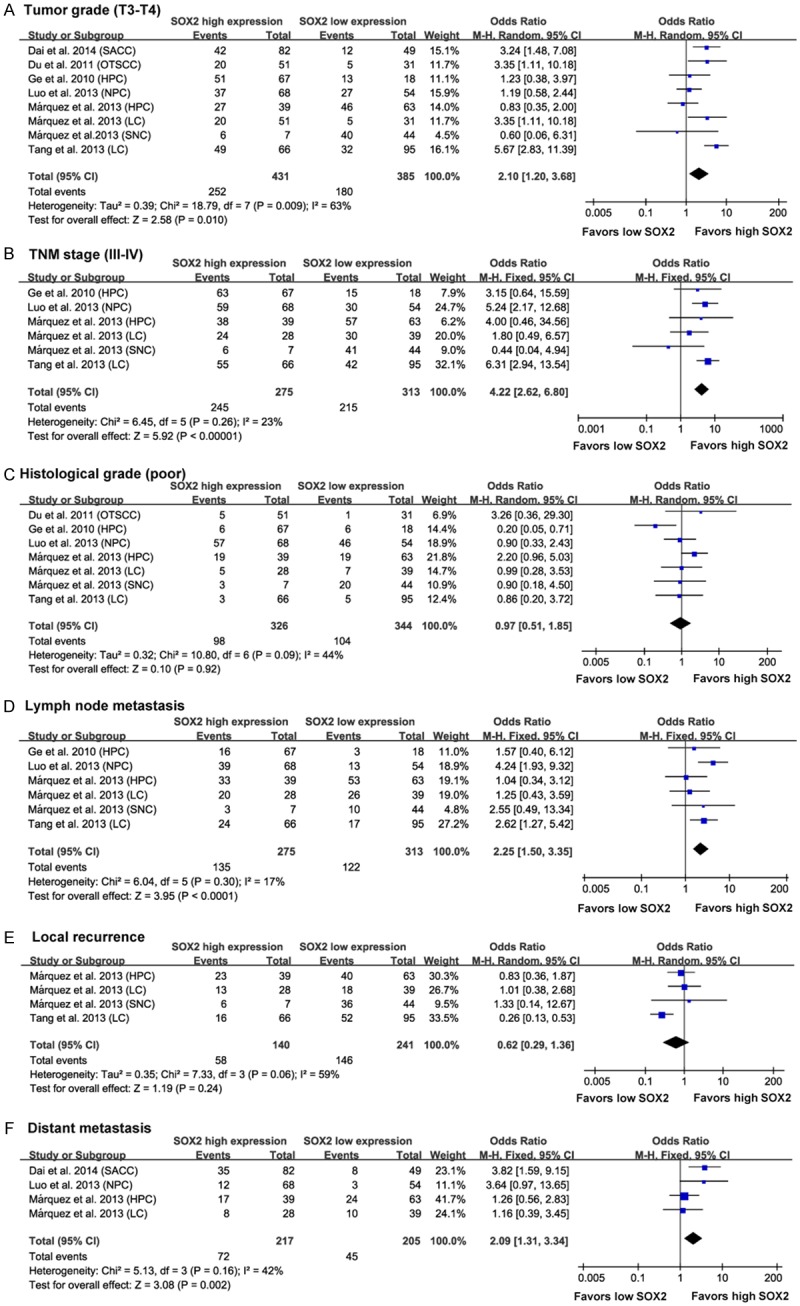
Figure 3.

Forest plots showing results of studies on the association between elevated SOX2 and clinicopathological parameters in HNC patients. Forrest plots display the correlation between SOX2 expression and high tumor grade (T3-T4) (A), advanced TNM stage (III-IV) (B), histological grade (poor) (C), lymph node metastasis (D), local recurrence (E) and distant metastasis (F) in HNC. Results are presented as individual and pooled odds ratio (OR), and 95% confidence interval (CI).
