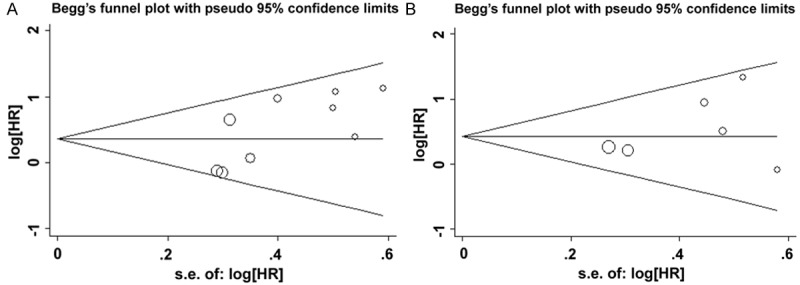
Figure 4.

Begg’s funnel plots for the evaluation of potential publication bias in the impact of SOX2 expression on the clinical outcome of HNC. A. Begg’s funnel plots of publication bias test for the overall merged analysis of OS. Each point represents a separate study; B. Begg’s funnel plots of the publication bias test for the overall merged analysis of DFS.
