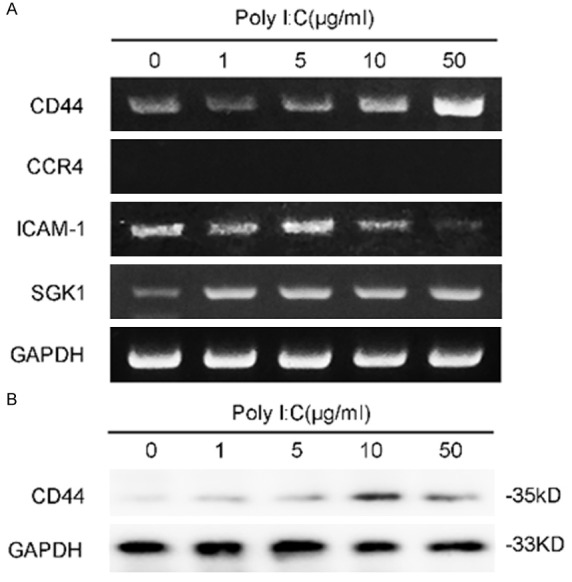
Figure 4.

Expression of selected migration associated molecules upon stimulation of TLR3. A. Reverse-transcriptase PCR shows the expression of CD44, ICAM-1, SGK1 and CCR4. K1 cells were treated with various concentration of poly I:C (as indicated) or PBS for 24 h and then subjected to total RNA isolation and PCR. B. Western blot shows the expression of CD44 at 36 h when treated with poly I:C.
