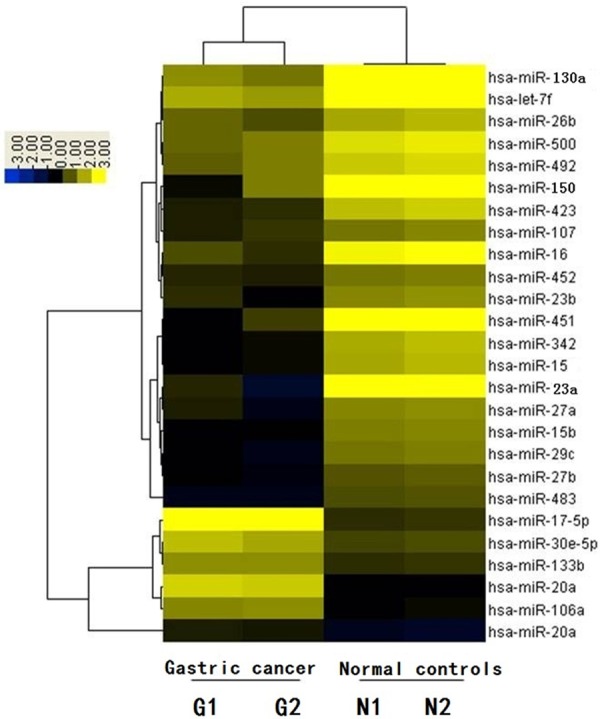
Figure 1.

Hierarchical cluster analysis of miRNA-microarray expression data of GC and normal. Array chips comprising 275 human mature miRNA probes identified a number of up- and down-regulated miRNAs in GC patients compared with normal subjects, among which 19 were distinctively down-regulated (such as miR-23a, miR-150, and miR-130a). Hierarchical clustering analysis showed that those miRNAs were significantly differentially expressed between GC patients and normal subjects (G-1, G-2: GC patients; N-1, N-2: normal controls).
